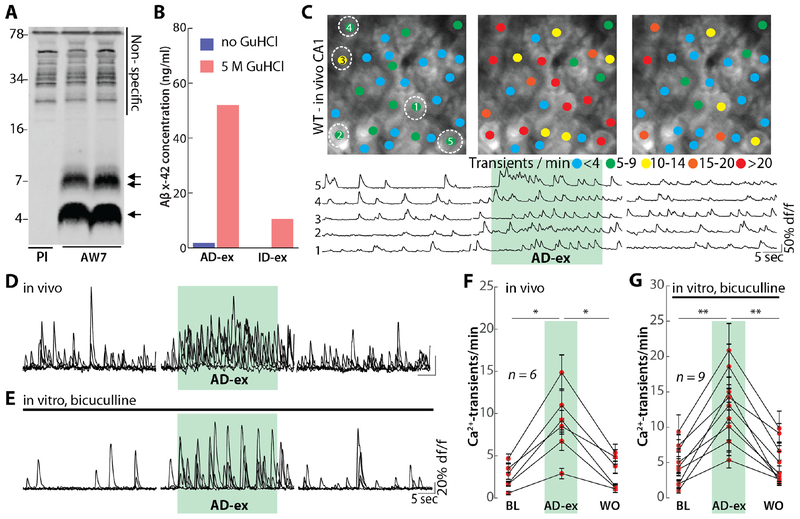
Fig. 4. Aβ derived from human AD patients induces neuronal hyperactivation.
(A) AD brain extracts were immunoprecipitated with anti-Aβ polyclonal antibody AW7 or pre-immune serum (PI) and IP’s analyzed by immunoblot using a combination of 2G3 and 21F12. Molecular weight markers are indicated on the left. At least two different Aβ species are in AD brain extract: monomers (single arrow) and SDS-stable Aβ dimers (double arrow). Non-specific bands detected are indicated by a solid black line. (B) Mock immunodepleted (AD-ex) and AW7 immunodepleted (ID-ex) brain extracts were analyzed by an MSD-based Aβx-42 immunoassay. To assess the levels of monomeric and soluble aggregated Aβ, samples were pretreated with or without incubation in 5 M GuHCl. The AD extract contained much higher amounts of aggregates than monomer, and both were effectively removed by AW7 immunodepletion. (C) Top: representative two-photon images of hippocampal CA1 in a wild-type mouse in vivo under baseline conditions (left), during the application of AD-ex (diluted 1:10) and after washout (right). The colored dots on the neurons indicate the number of Ca2+-transients per minute. Bottom: Ca2+-traces of the five neurons circled in the top panel. The green shaded area represents the time of AD extract application. Scale bar: 5 μm. (D) Overlaid Ca2+-traces from 5 representative neurons recorded in vivo under baseline (left), AD-ex application (middle) and washout conditions (right). The green shaded are corresponds to the time of AD extract application. (E) Overlaid Ca2+-traces from 5 neurons recorded in vitro in a slice treated with bicuculline under baseline (left), AD-ex application (middle) and washout conditions (right). The green shaded are corresponds to the time of AD-ex application. (F) Summary data for the experiment in (D). Each dot represents the mean number of Ca2+-transients per minute for all neurons in one mouse under baseline (BL), AD-ex application and washout (WO) conditions. (G) Summary data for the experiment in (E). Error bars show SEM. Wilcoxon signed rank test. ** P<0.005, *P<0.05.

