Figure 2.

Stimulus space. Each Gabor stimulus is represented by a pair of points that are symmetric with respect to the temporal frequency axis. Points far from this axis have high contrast, and points on the axis have zero contrast.

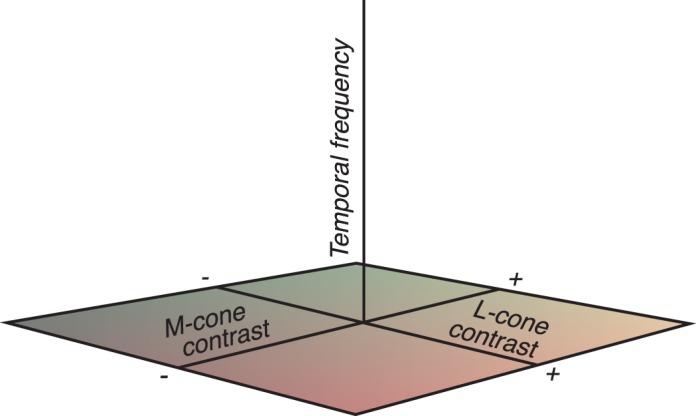
Stimulus space. Each Gabor stimulus is represented by a pair of points that are symmetric with respect to the temporal frequency axis. Points far from this axis have high contrast, and points on the axis have zero contrast.