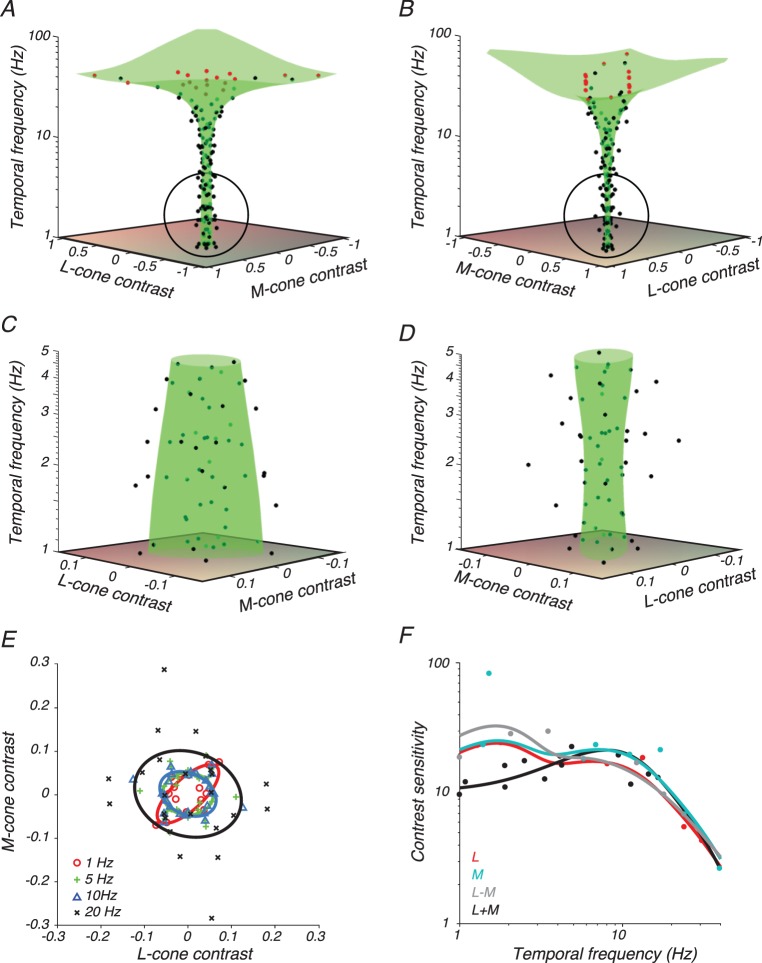
Figure 3.
Data from subject M2 and model fit. (A–D) Contrast detection thresholds (black points) on trials in which the stimulus appeared 5° from the fixation point on the horizontal meridian. Stimulus directions for which a threshold could not be measured because of limitations of the display gamut are plotted at the gamut edge (red points). Surfaces are best fits of Equation 7 (green). (A) Stimulus space oriented so that the L+M axis is in the plane of the page. (B) Stimulus space oriented so that the L−M axis is in the plane of the page. (C, D) Magnified views of the circled portion of A and B, respectively. (E) Cross sections through the surfaces in A–D parallel to the LM plane at 1 Hz (red), 5 Hz (green), 10 Hz (blue), and 20 Hz (black). Detection thresholds (symbols) were collected from bins that spanned the nominal temporal frequency ± a factor of 1.5. (F) Contrast sensitivity measurements (points) and 1-D functions from the model fit (curves) in the L-cone direction (red), M-cone direction (cyan), L−M direction (gray), and L+M direction (black). Data points were collected from bins that spanned the nominal color direction ± 10°.

