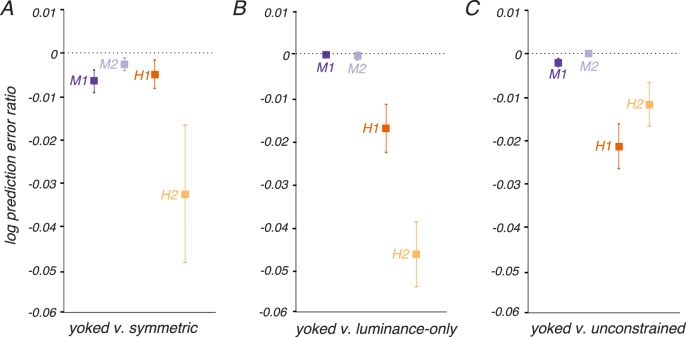
Figure 7.
Cross-validated model comparisons. Individual threshold measurements were withheld from fitting and used to calculate prediction errors for four models: symmetric (b3 = 0 for both ξLUM and ξRG), yoked (a single b3 parameter was shared by ξLUM and ξRG), luminance-only (b3 = 0 for ξRG), and unconstrained (b3 was fit separately for ξLUM and ξRG). The prediction error is quantified as log10(measured threshold) − log10(predicted threshold), where threshold is measured in units of stimulus modulation amplitude (Equation 4). The ratio of prediction errors between models was calculated for each threshold measurement. Negative log prediction error ratios indicate that the yoked model produced lower prediction errors than the alternative model. Points and error bars indicate medians and bootstrap estimates of standard error. More data were collected from monkeys than humans, resulting in smaller error bars for monkeys.

