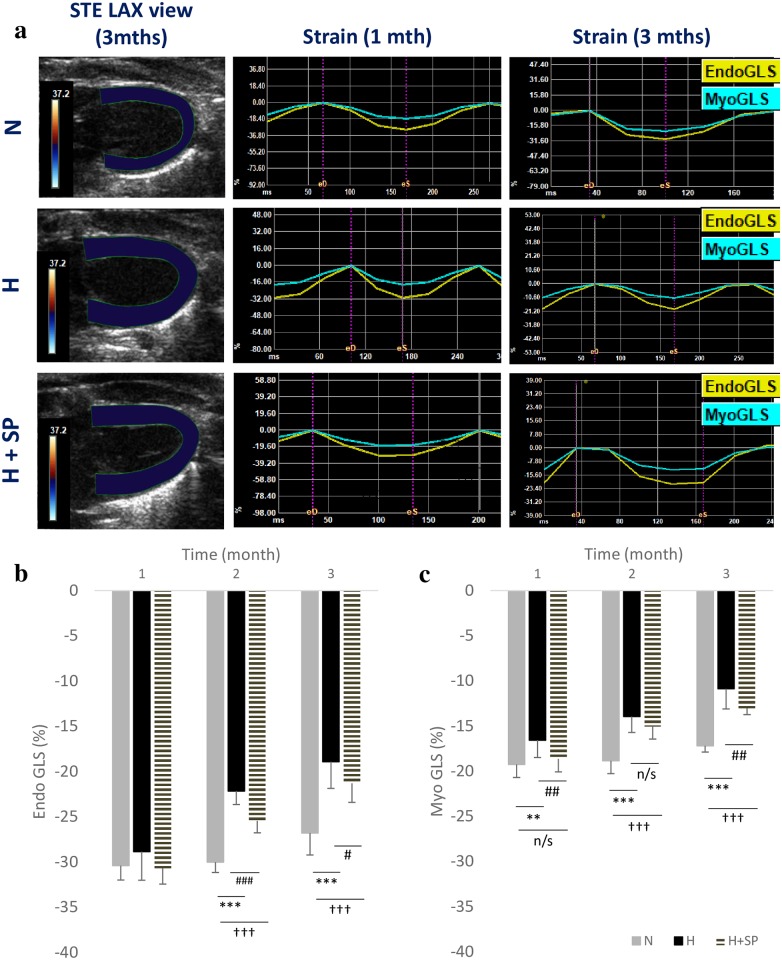
Fig 4. Global longitudinal strain analysis.
Global longitudinal strain (GLS) tracking analysis (a), showing the region of interest and the strain assessment at both one month and three months in normotensive (N), hypertensive (H) and hypertensive with spironolactone (H+SP) groups. (b) Analysis of the endocardium layer and (c) myocardium layer from normotensive (N), hypertensive (H) and hypertensive animals with spironolactone (H+SP) following one, two and three months. Values are shown as mean ± standard deviation. Significant differences between N and H is indicated by *, p<0.05 *, p<0.01 **, p<0.001 *** Significant differences between N and H+SP is indicated by †, p<0.05 †, p<0.01 †† Significant differences between H and H+SP is indicated by #, p< 0.05 #, p<0.01 ##.

