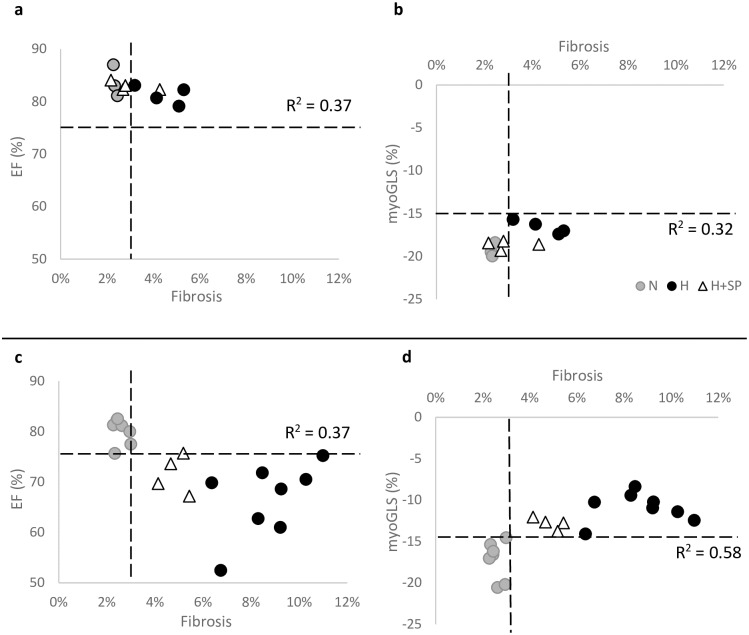
Fig 5. Comparison of left ventricular fibrosis and myocardial global longitudinal strain.
Data from individual animals comparing left ventricular cardiac fibrosis (%) against EF% (a, c) and myo-GLS (b, d) in normotensive animals (N, grey circles, data only available following three months), hypertensive animals (H, black circles) and hypertensive animals dosed daily with spironolactone (H+SP, triangles) after one month (a, b) and three months (c, d). The black dotted lines represent the 95% CI normal reference range of the normotensive animals. r2 correlation values are shown on each graph for all data.

