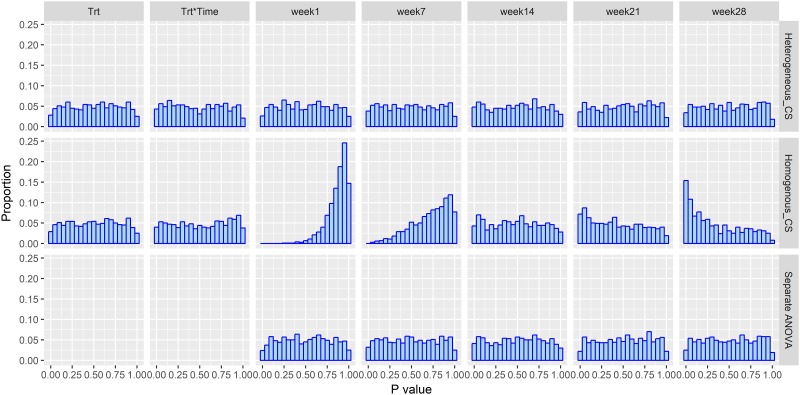
Fig 1. Data analysis using heterogeneous_CS as in Eq (1), homogeneous_CS in Eq (3), and separate ANOVA based on the null model simulation with ρ = 0.3, n = 12 and a heterogeneous_CS variance covariance structure.
Trt: overall treatment effect. Trt*Time: Treatment by Time interaction. Week 1, Week 7, Week 14, Week 21, and Week 28: p-value distribution at each time point. Proportion = count per bin/1000.

