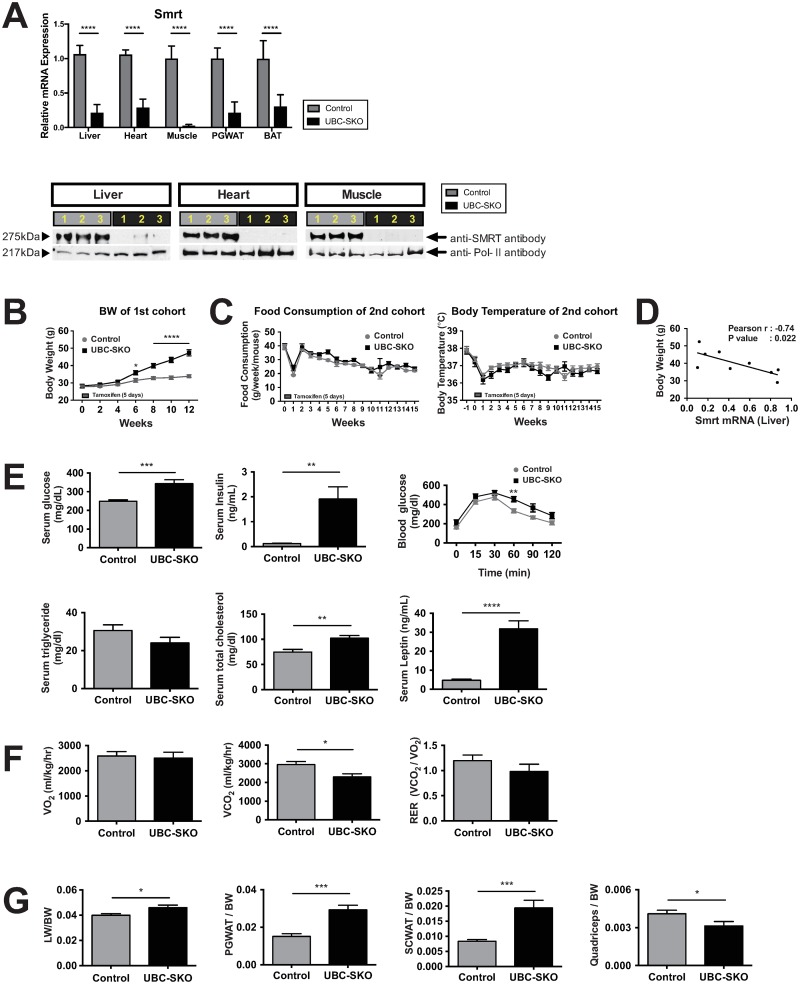
Fig 1. Global SMRT deletion leads to obesity, glucose intolerance, and lower energy expenditure.
(A) We used qPCR analyses to determine the level of Smrt exon 11 expression in the liver, heart, muscle, PGWAT, and BAT at 12 weeks after tamoxifen treatment. Also Western blot analysis was used to determine the levels of SMRT protein using a SMRT specific antibody in the 1st cohort of mice. Three samples were run in control mice (gray) and UBC-SKO mice (black). Blots were stripped and re-probed with anti-Pol-II as control. (B) Body weights in the 1st cohort of mice starting at Day0 of tamoxifen administration through 12 weeks. (C) Food intake and body temperature were measured weekly (2nd cohort). (D) We calculated the correlation between the levels of SMRT expression in the liver and body weight (2nd cohort). (E) Serum glucose, insulin, glucose tolerance tests, serum triglyceride, total cholesterol, and leptin were measured at 12 weeks after tamoxifen treatment (2nd cohort). (F) The 2nd cohort mice were placed in a CLAMS apparatus and monitored for oxygen consumption (VO2), carbon dioxide consumption (VCO2), and Respiratory-expiratory ratio (RER) over 72 hours. All data were normalized to body weight. (G) The weights of liver, PGWAT, SCWAT, and quadriceps were normalized to body weight in the 2nd cohort of mice. For qPCR data in panels A, and panels E-G (except the figure of the glucose tolerance test in panel E), the data were analyzed by unpaired t-test. In the analyses for BW (panel B), Food consumption (panel C), Body temperature (panel C), and glucose tolerance (panel E), Repeated Measures Two-way ANOVA was used. Results are shown as the mean±SEM, the p-value was shown as; ****, p< 0.0001; ***, p< 0.001; **, p< 0.01; *, p< 0.05. Panel D was analyzed by Pearson’s correlation coefficient analysis, and the p-value was shown as p = 0.022; *, p< 0.05. 1st cohort included n = 6–7 mice/group, and 2nd cohort included n = 6–8 mice/group.

