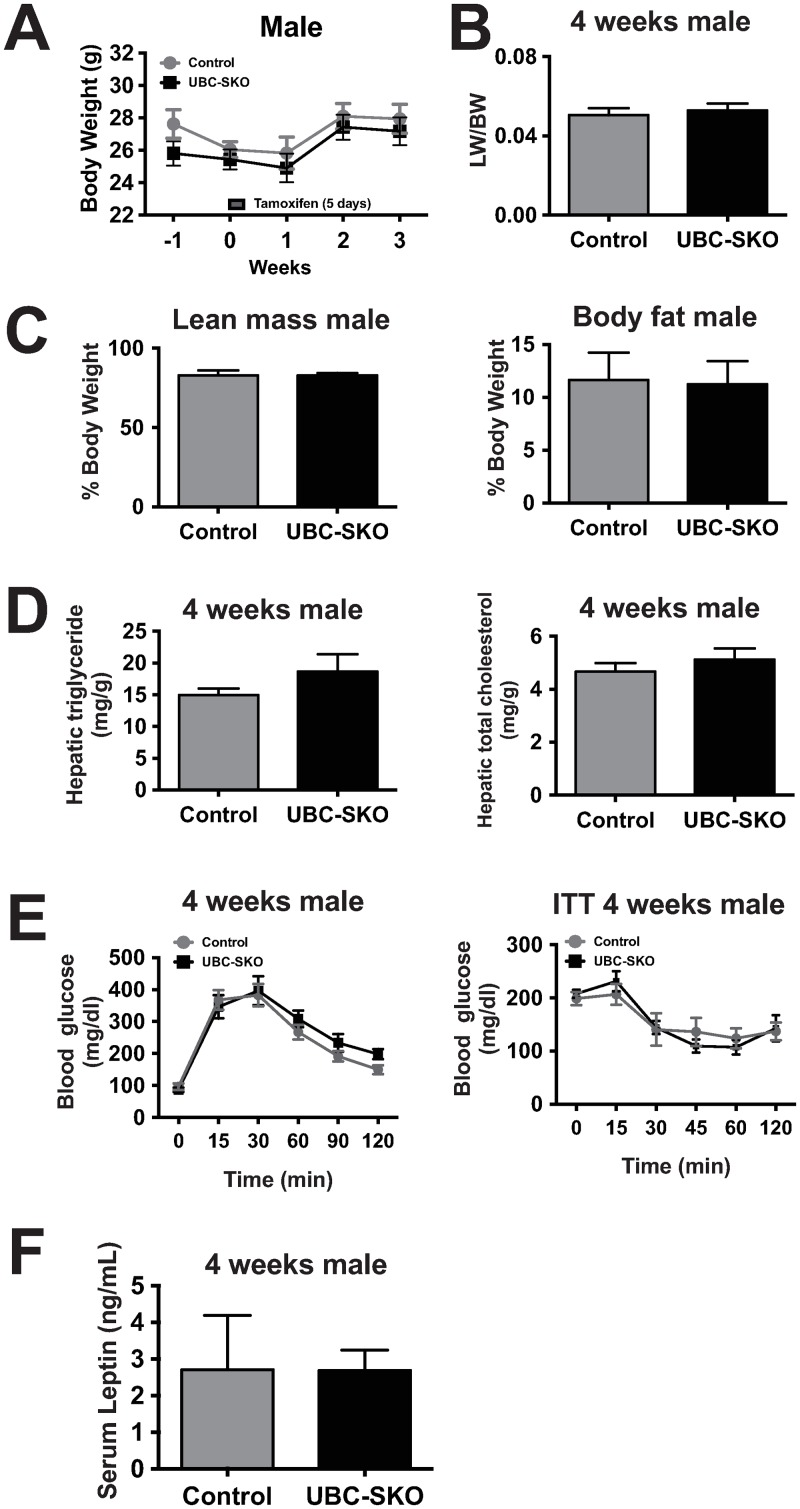
Fig 4. Insulin resistance and fatty liver in UBC-SKO mouse occur secondary to the progression of obesity.
(A) Body weight of control and UBC-SKO mice were measured weekly for 3 weeks after tamoxifen treatment in the 3rd male cohort. (B) Liver weights in control and UBC-SKO of male mice (3rd cohort). (C) Body composition was measured via MRI in control and UBC-SKO male mice (3rd cohort). (D) Hepatic triglyceride and cholesterol levels were measured in both control and UBC-SKO male mice (3rd cohort). (E) Glucose tolerance and insulin tolerance tests were performed in male mice 4 weeks after tamoxifen treatment (3rd cohort). (F) Serum leptin levels were measured in both control and UBC-SKO male mice (3rd cohort). All results are shown as the mean±SEM. For panels A and E, Two-way Repeated-Measures ANOVA was used. For panels B, C, D, and F, the data were analyzed by unpaired t-test (3rd male cohort n = 7–8 mice/group).

