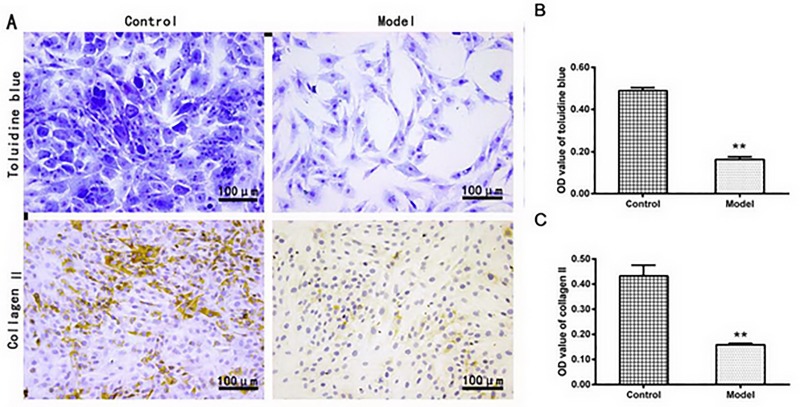
Fig 2.
(A) The representative images of toluidine blue staining and collagen II immunohistochemical staining in chondrocytes, showing the proteoglycan or collagen II in the model group were significantly lower compared with the control group(B and C) as indicated by the semi-quantitative analysis (n = 3 per group. **P < 0.01: the control group vs. the model group).

