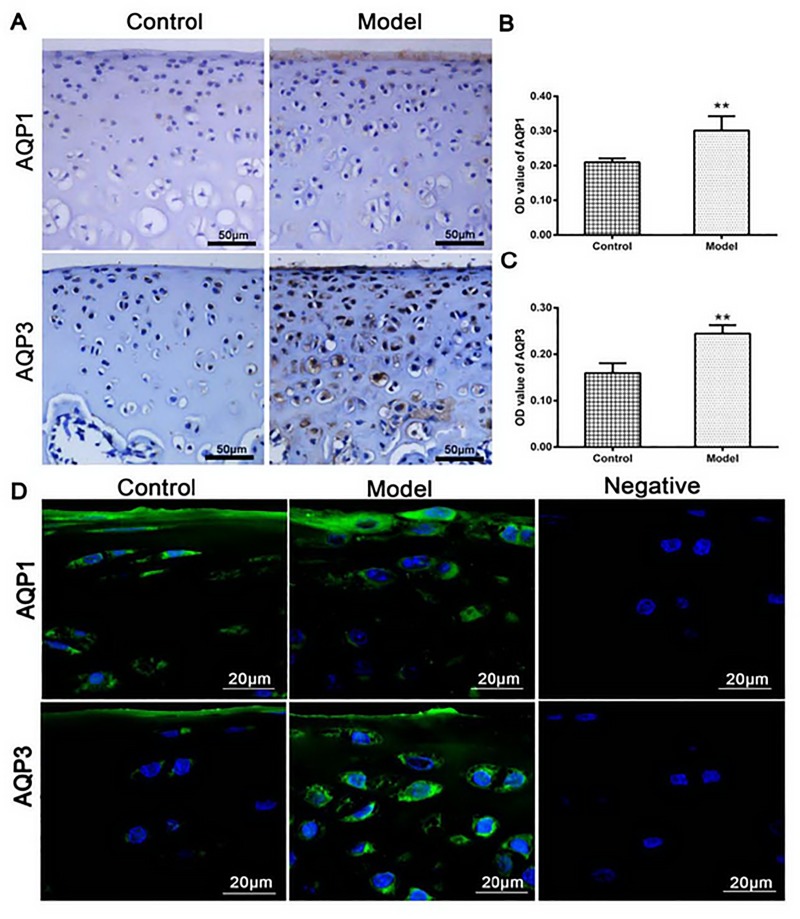
Fig 5.
(A) The expressions of AQP1 and AQP2 in model group were higher than those in the control group as shown by the semi-quantitative analysis (B and C). Similar higher expressions and locations of AQPs were detected again by immunofluorescent assay (D, color green, the cell nuclei were stained with blue). Negative control was detected no expressions of AQPs (the control group vs. the model group **P < 0.01, n = 12 per group).

