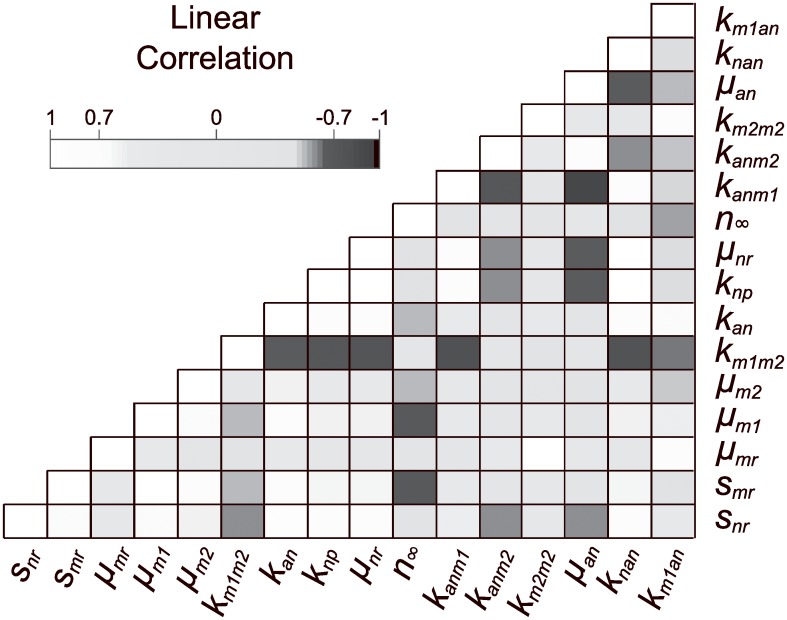
Fig 5. Correlation matrix plot for the full model.
An approximate correlation matrix was obtained from the Fisher Information Matrix for the sensitive subset of parameters and used to visualize correlations. There are many significant linear correlations (greater than 0.7) between sensitive parameters that appear as black or white squares on the off diagonal.

