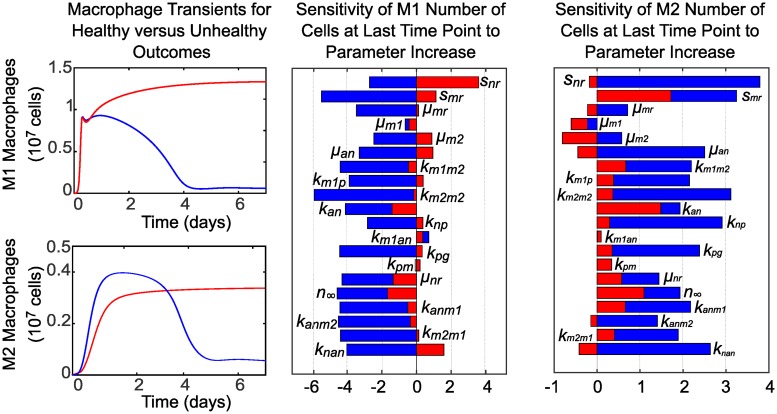
Fig 10. Sensitivity of M1 and M2 characteristics to parameter variations in the case of delayed neutrophil apoptosis (unhealthy response) versus a healthy response.
Predictions and sensitivities for a healthy response are plotted in blue, while predictions and sensitivities for an unhealthy response are plotted in red. A healthy M1 and M2 response that resolves, with all parameters at baseline values given in Tables 1 and 4 (including kan = 7.108), is plotted versus an unhealthy, sustained M1 and M2 response resulting from reducing the value of parameter kan to 5.56 while holding all other parameters constant. The bar charts compare the associated sensitivity of M1 and M2 characteristics to parameter variations in the healthy case versus the unhealthy case. Insensitive parameters, which have zero sensitivity for all characteristics, are not shown.

