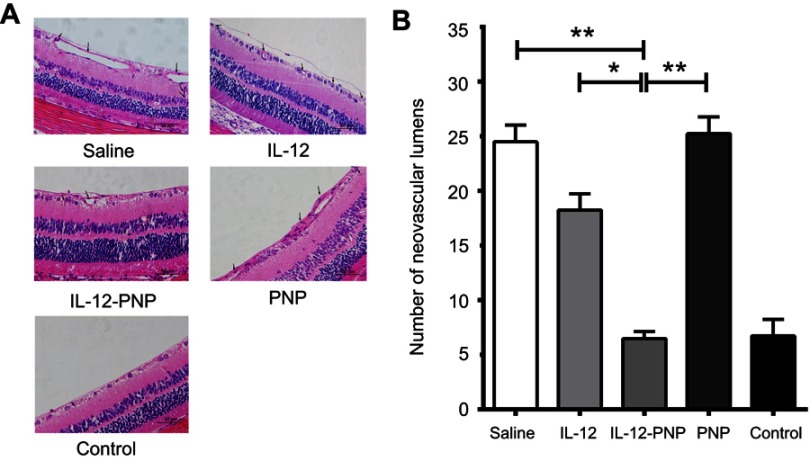
Figure 8.
Quantitative analysis of retinal neovascularization by counting vascular lumens on day 7 after intravitreal IL-12 or IL-12-PNP injections. Each group consisted of six mice. (A) H&E-stained sections. Vascular lumens of new vessels growing into the vitreous humor are indicated by black arrows. Bar =50 μm. (B) Data in each column are mean ± SD (n=12). One-way ANOVA and Newman-Keuls post-hoc test were used to determine differences among ≥3 groups. *P<0.05; **P<0.05.

