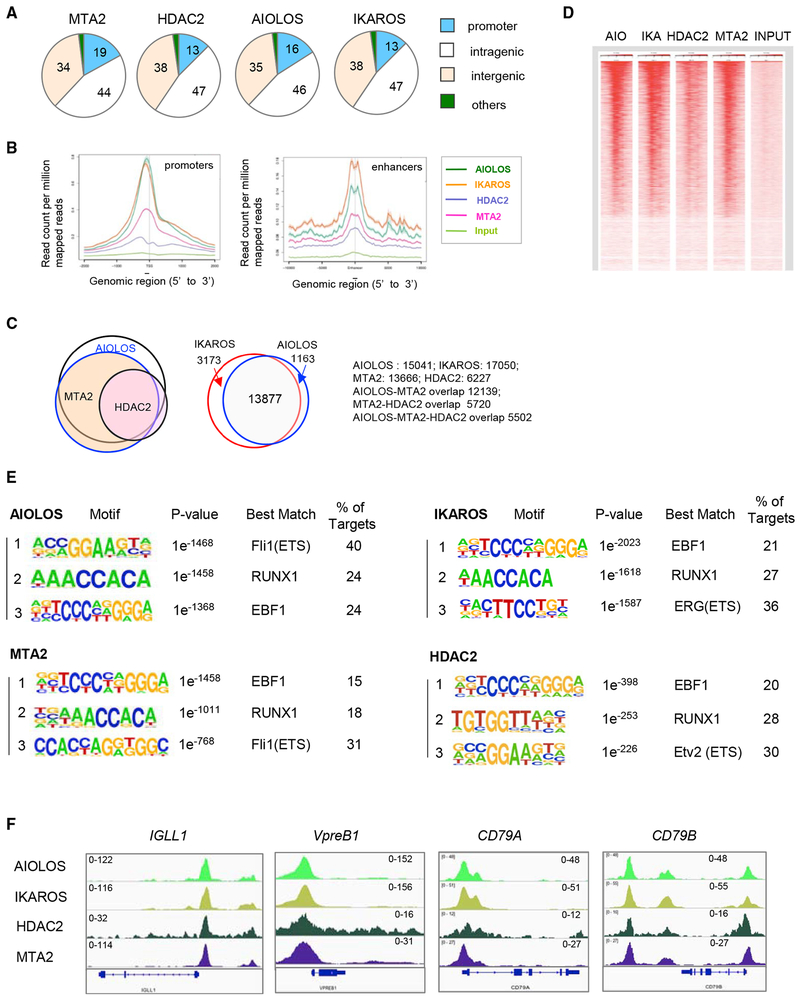
Figure 4. Genome-Wide Mapping of MTA2, HDAC2, AIOLOS, and IKAROS in Human Pre-B Cells.
(A) Distribution of MTA2, HDAC2, AIOLOS, and IKAROS binding sites at different genomic locations in 697 human pre-B cells. Numbers indicate the percentage of total sites at each location.
(B) Meta-gene analysis of average enrichment of indicated factors around transcription start sites (TSSs) (left panel) and enhancers (right panel).
(C) Venn diagrams showing significant overlaps between AIOLOS, MTA2, and HDAC2 target genes (left panel) and between IKAROS and AIOLOS target genes (right panel).
(D) A heatmap generated by normalized read densities from individual ChIP-seq data (AIO, AIOLOS; IKA, IKAROS) centered at TSS and ranked by AIOLOS peak signals.
(E) Consensus AIOLOS-, IKAROS, MTA2, and HDAC2 recognition sequences identified by de novo-motif identification in 697 cells. The more detailed summaries of DNA motifs recognized by these factors are listed in Tables S1–S4.
(F) ChIP-seq snapshots of AIOLOS, IKAROS, HDAC2, and MTA2 binding at pre-BCR gene promoters in 697 cells. The scales of ChIP-seq signals are indicated.

