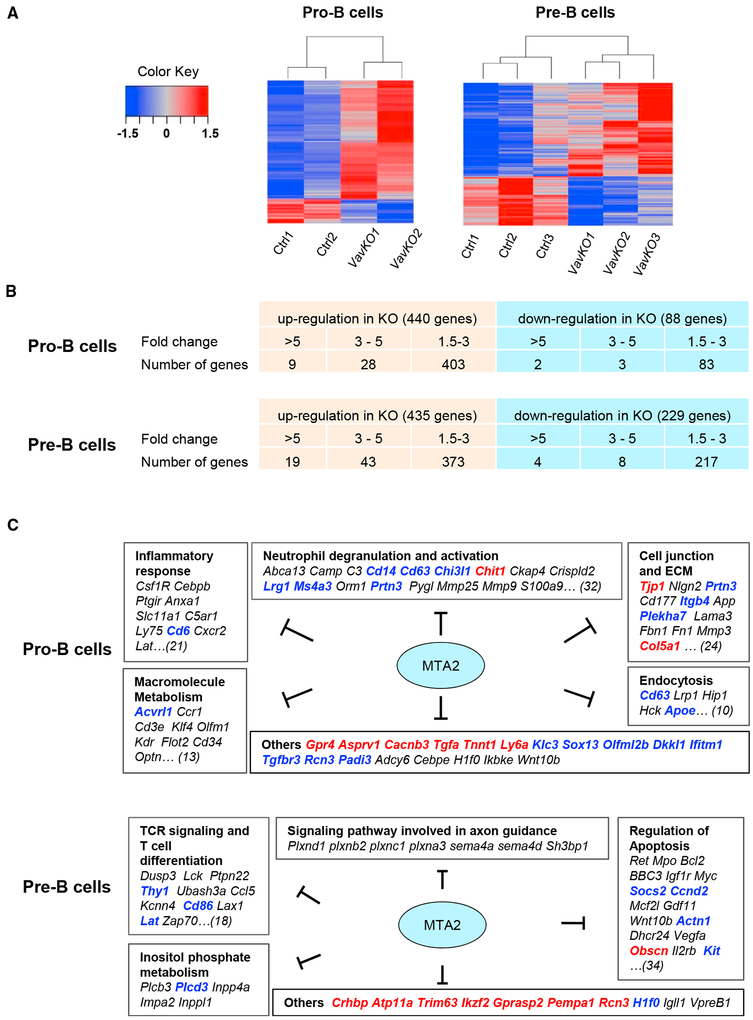
Figure 5. Distinct MTA2-Dependent Transcriptional Programs in Mouse Pro-B and Pre-B Cells.
(A) Heatmaps based on RNA-seq data from Vav-Cre Mta2fl/fl (VavKO) and control pro-B (left) and small pre-B (right) cells.
(B) Numbers of genes that show increased or decreased expression in pro-B and small pre-B cells upon loss of Mta2 (threshold 1.5-fold).
(C) Gene ontology (GO) analyses of MTA2-regulated pathways and processes in pro-B and small pre-B cells (black, 1.5- to 3-fold change; blue, 3–5-fold; red, >5-fold).

