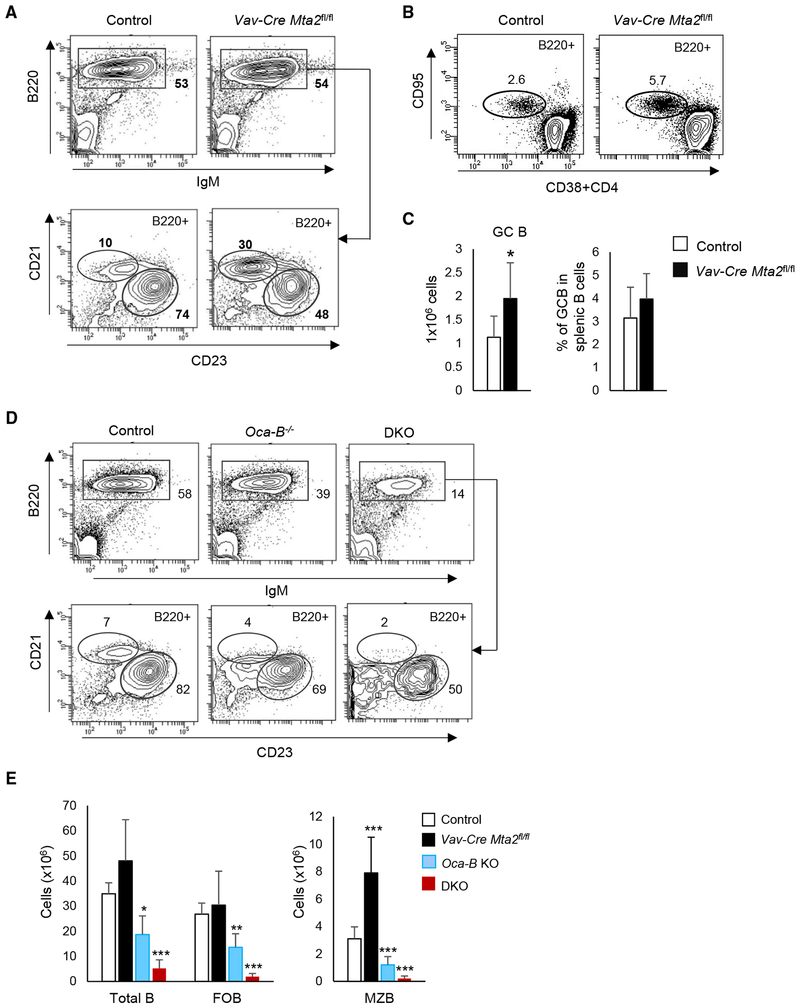
Figure 7. Abnormal Splenic B Cell Differentiation and B Cell Response in Mice Lacking MTA2 or Both MTA2 and OCA-B.
(A) Staining of total splenic B (B220+), marginal zone B (MZB) (B220+CD21hiCD23lo), and follicular B (FOB) (B220+CD21−CD23hi) cells in Vav-Cre Mta2fl/fl and control mice. Frequencies of different cell populations in parental cells are indicated.
(B) Staining of germinal center B (GCB) (B220+CD95+CD38−CD4−) cells in Vav-Cre Mta2fl/fl and control mice immunized by sheep red blood cells (SRBCs).
(C) Numbers of GCB cells and frequencies of GCB cells in splenic B cells are plotted (n = 8 for each genotype; t test; *p = 0.02).
(D) Staining of splenic B, MZB, and FOB cells in mice with indicated genotypes.
(E) Cell numbers of different B cell subsets are plotted (n = 10 for control, n = 9 for Vav-Cre Mta2fl/fl, n = 5 for Oca-B−/− and DKO mice; t test; *p < 0.05, **p < 0.01, ***p < 0.001).

