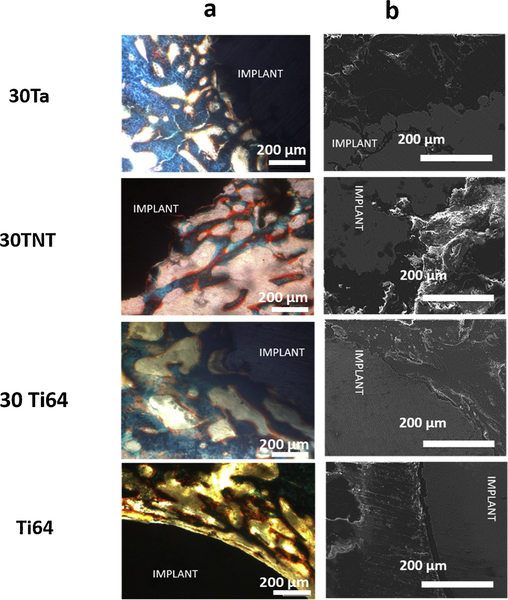
Fig. 3.
a shows optical and b shows FESEM micrographs of bone-implant interface 5 weeks post implantation. Osteoid formation is shown in reddish orange color and mineralized bone in bluish-green color. Presence of gaps between the host bone and implant interface has been observed in the Dense Ti64 samples. 30Ta, 30Ti64 and 30TNT samples show very good bone-implant interlocking with comparable osteoid formation in 30TNT and 30Ta treatments (For interpretation of the references to colour in this figure legend, the reader is referred to the web version of this article).

