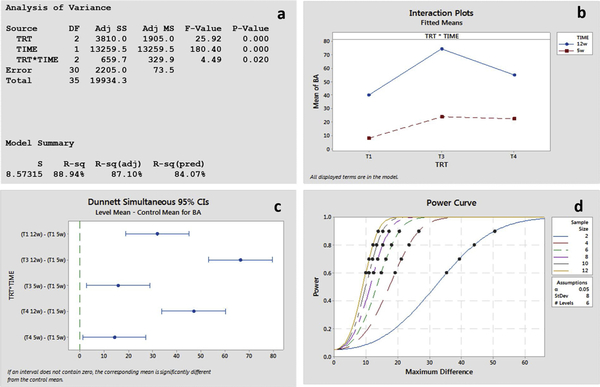
Fig. 6.
a ANOVA results showing significant interaction between treatment and time points, b. Interaction plot for 5 and 12 weeks for dense Ti64 (T1), 30Ta (T3) and 30TNT (T4), c. Dunnett simulation for multiple comparisons showing difference in means between control and treatments, d. post-hoc power analysis curve for effective sample size 80%.

