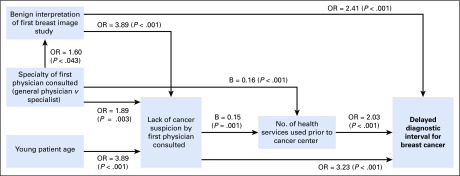
FIG 3.
Mechanisms through which young age influences diagnostic delay. This path diagram represents causal relationships between variables. Where there are no arrows between variables, no association was found. The reported regression coefficients or odds ratios (ORs) on each arrow were adjusted using multivariable analyses that included the variables that appear on the diagram to the left of each dependent variable. The ORs were estimated using logistic regression analysis when the dependent variable was categorical, and the B coefficients were estimated using lineal regression for continuous dependent variables. For example, for the analysis of the diagnostic interval, which was a binary response variable, the OR of 3.23 of lack of cancer suspicion by the first doctor consulted is the adjusted OR obtained by a multivariable logistic regression where all the variables in the diagram were included as controls. As can be seen, young patient age is not directly associated with diagnostic delay, but delays occur because of a lack of cancer suspicion by the first doctor consulted.

