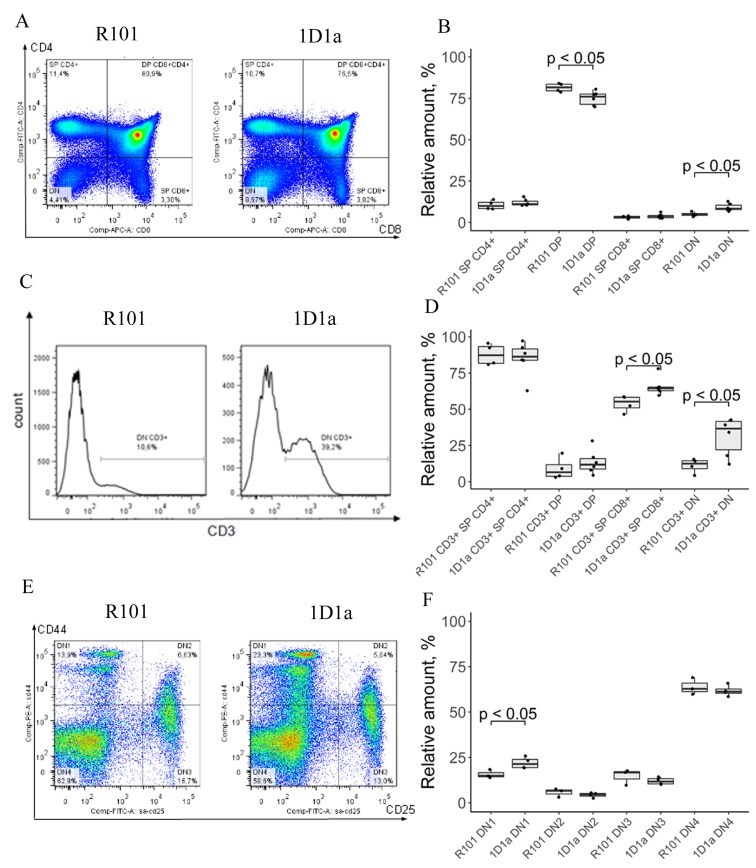
Figure 2. Flow-cytometric analysis of lymphocyte subpopulations in thymus of WT and Tg 1D1α mice.
(A) Dot plots show expression of CD8 vs CD4 on thymocytes of WT (left) and Tg (right) mice. (B) DN, CD4 SP, and CD8 SP and DP subpopulations in thymus of R101 and 1D1α mice. (C) The histogram visualizes the expression of the CD3 marker on DN thymocytes. (D) The percentages of CD3+ DN, CD3+ CD4 SP, CD3+ CD8 SP, and CD3+ DP thymocytes are shown. (E) Co-expression of CD44 and CD25 on DN-gated thymocytes. (F) The box plot shows the distribution of thymocytes over different stages of DN development defined by CD44 and CD25 surface expression. SP – single positive, DN – double negative, DP – double positive. (A), (C), (E) Data from one representative staining are shown.

