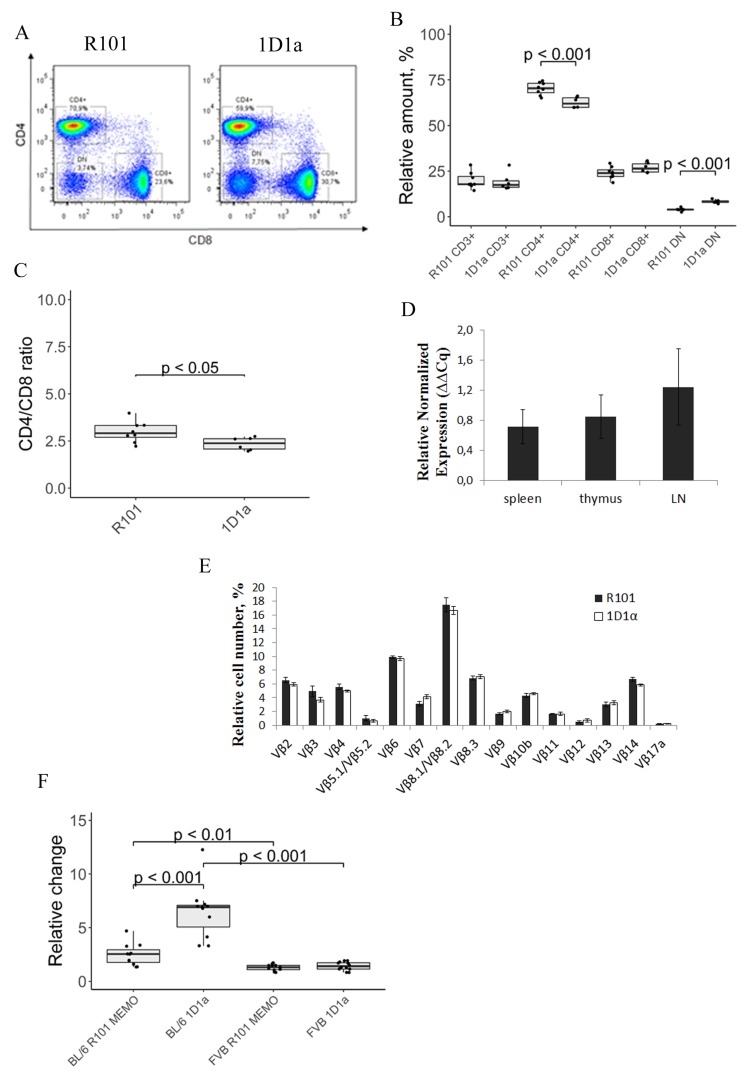
Figure 3.
(A) Flow-cytometric analysis of CD8 and CD4 expression on CD3-gated lymphocytes from the spleen of wild-type (left) and Tg (right) mice. Data from one representative staining are shown. (B) The box plot represents the number of CD3, CD4, CD8, and DN cells in the spleen of R101 and 1D1α mice. (C) The ratio of CD4 to CD8 T cells in the spleen of R101 and transgenic (1D1α) mice is shown. (D) Relative expression of Tg T-cell receptor α-chain 1D1 in lymphoid organs of Tg mice. Four transgenes were used for the qPCR analysis. The spleen of one Tg mouse was used as a reference sample. Tbp and ppia were used as reference genes for normalization of gene expression. The samples were run in triplicate. The data represent the mean and sd. (E) Analysis of expression of 14 distinct Vβ gene families in peripheral blood T cells of Tg and WT mice. Six transgenes and 5 WT mice were used in the experiment. The data represent the mean ± sd. (F) Proliferative response of splenocytes to specific and third-party alloantigens. Cells from spleens of 3-month-old Tg and WT mice were used as responders. Splenocytes from B10.D2(R101) (syngeneic), C57BL/6 (specific alloantigen), and FVB (third-party alloantigen) were used as stimulators. All stimulators were treated with mitomycin C. The background proliferation (i.e. the proliferative response to syngeneic stimulators) was subtracted from values obtained in response to the specific and third-party alloantigens. The excess of proliferative response of splenocytes to C57BL/6 and FVB stimulators of R101 MEMO (BL/6 R101 MEMO and FVB R101 MEMO, respectively, and Tg (BL/6 1D1α and FVB 1D1α, respectively) over R101 splenocytes is shown.

