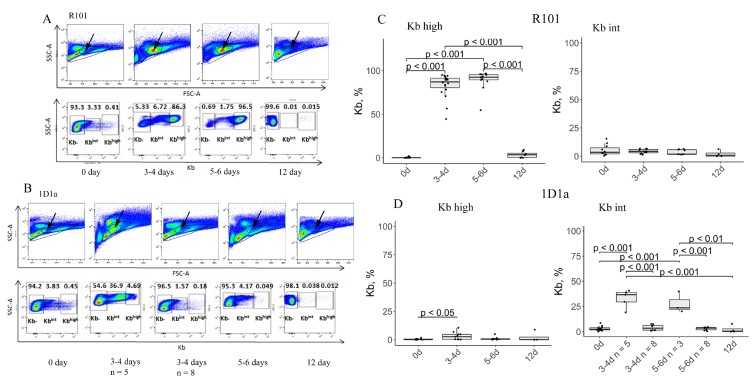
Figure 4. Estimation of tumor cell number in the peritoneal cavity on days 0, 3-4, 5-6, and 12 after immunization.
(A, B) Flow-cytometric analysis of EL-4 tumor cells in the lavage of WT (A) and Tg (B) mice. Arrows on the upper panels indicate the presence of EL-4 cells in samples as determined by forward scatter (FSC) and side scatter (SSC). The lower panels represent the number of Kb positive cells in the peritoneal cavity. We distinguished two populations of Kb+ cells – with high (Kbhigh) or decreased (Kbint, intermediate) expression of Kb. Data from one representative staining are shown. (C, D) Box plots show the number of Kbhigh (left) and Kbint (right) EL-4 cells in the lavage of WT (C) and Tg (D) mice on the days 0, 3-4, 5-6, and 12 after immunization.

