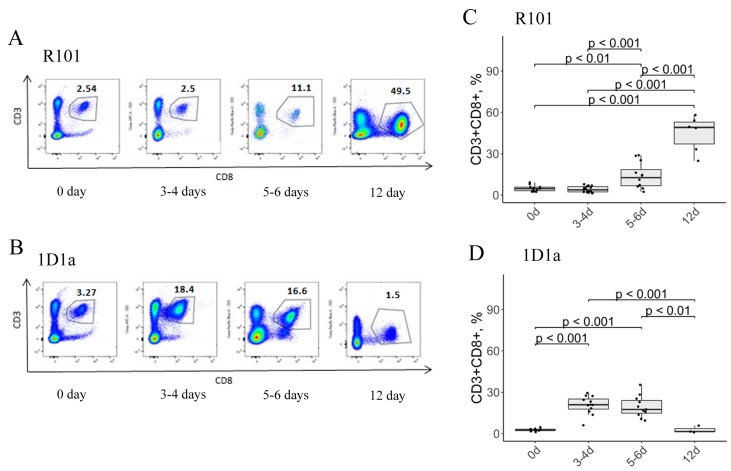
Figure 5. Flow-cytometric analysis of CD3/CD8 expression on lymphocytes from the peritoneal cavity of WT (A, C) and Tg (B, D) mice on days 0, 3-4, 5-6, and 12 after immunization.
(A, B) Data from one representative staining are shown. (C, D) Box plots are used to visualize the distribution of a dataset.

