Figure 6.
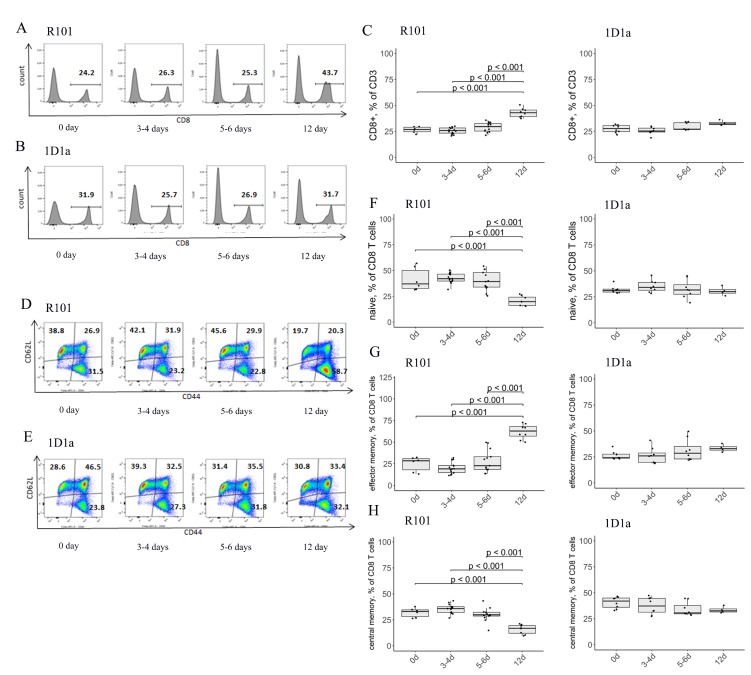
(A–C) Flow-cytometric analysis of expression of CD8 and activation markers CD44 and CD62L on splenic T lymphocytes on days 0, 3-4, 5-6, and 12 after immunization. The expression of CD8- on CD3-gated lymphocytes was defined in the spleen of WT (A, C) and Tg (B, C) mice. (A, B) Data from one representative staining are shown. (C) The box plot shows the relative number of CD8+ T cells in the spleen of R101 (left) and 1D1α (right) mice. (D–H) Flow-cytometric analysis of co-expression of CD44 and CD62L markers on the surface of the CD8 subset of T lymphocytes in the spleen of WT (D, F, G, H) and Tg (E–H) mice. Data from one representative staining are shown. The box plots show the distribution of cells with naive (CD44-CD62L+) (F), effector memory (CD44+CD62L–) (G), and central memory (CD44+CD62L+) (H) phenotypes.

