Figure 1.
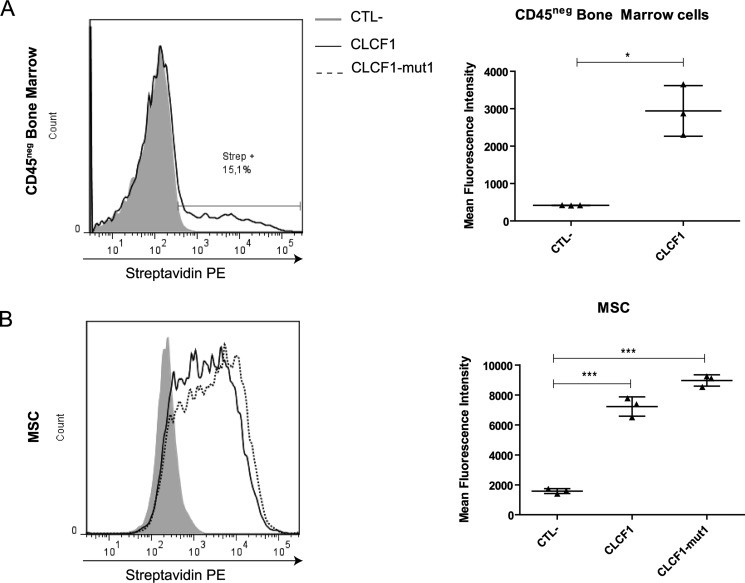
CLCF1 binds to a CD45− population in mouse bone marrow and to MSCs. A, freshly isolated bone marrow cells (1 × 10⁶ cells) were incubated with biotinylated CLCF1 (1 μg/ml) for 1 h and then stained with an allophycocyanin-conjugated anti-CD45.2 mAb and PE-conjugated streptavidin to detect the CLCF1 binding. Fluorescence was measured by flow cytometry. The gray-filled histogram and the black line show the PE-conjugated streptavidin control stain and the CLCF1 binding, respectively, both on the gated CD45neg population. The vertical dot plot shows the mean fluorescence intensity ± S.D. (error bars) of the CLCF1 binding compared with the control staining. Student's t test was used to assess statistical significance. *, p < 0.05; ***, p < 0.001 (n = 3 technical replicates). B, MSCs (1 × 10⁶ cells) were incubated with biotinylated CLCF1 or CLCF1-mut1 (both at 1 μg/ml) for 1 h and then stained with a PE-conjugated streptavidin. Fluorescence was measured by flow cytometry. The gray-filled histogram represents the fluorescence of MSCs incubated with streptavidin alone. The solid and the dotted lines represent the fluorescence of MSCs incubated with CLCF1 + streptavidin and CLCF1-mut1 + streptavidin, respectively. The vertical dot plot shows the mean fluorescence intensity ± S.D. of the CLCF1 and the CLCF1-mut1 bindings compared with the control staining. Student's t test was used to assess statistical significance. *, p < 0.05; ***, p < 0.001 (n = 3 technical replicates).

