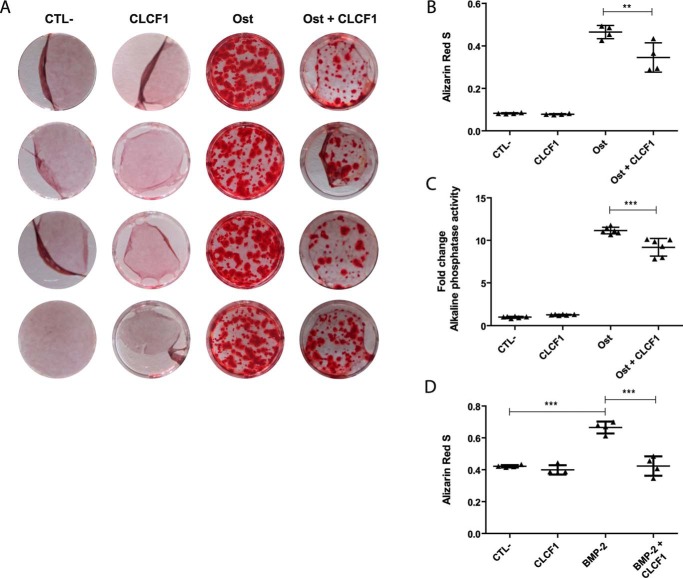
Figure 4.
CLCF1 inhibits MSC differentiation into osteocytes. A, photographs of the alizarin red S–stained cells. MSCs were expanded in AMEM medium (CTL−), AMEM medium with CLCF1 (100 ng/ml) (CLCF1), osteogenic medium (Ost), or osteogenic medium supplemented with CLCF1 (100 ng/ml) (Ost + CLCF1) for 3 weeks. Calcium deposits were stained with alizarin red S. B, alizarin red S was extracted using cetylpyridinium chloride (10%), and the A570 nm was assessed using 1:5 diluted samples. Vertical dot plots represent mean A ± S.D. (error bars), n = 4 technical replicates. C, to quantify alkaline phosphatase activity, MSCs were lysed in 1% Triton X-100 and incubated with p-nitrophenyl phosphate for 10 min. The total protein concentration was used to normalize the values. Vertical dot plots represent mean alkaline phosphatase activity ± S.D., n = 6 technical replicates. Statistical significance was analyzed using analysis of variance. **, p < 0.01; ***, p < 0.001. D, MSCs were expanded in AMEM medium (CTL−), AMEM medium with CLCF1 (100 ng/ml) (CLCF1), BMP-2 osteogenic medium (BMP-2), or BMP-2 osteogenic medium supplemented with CLCF1 (100 ng/ml) (BMP-2 + CLCF1) for 3 weeks. Calcium deposits were stained with alizarin red S and extracted as in B, and the A570 nm was assessed using undiluted samples.

