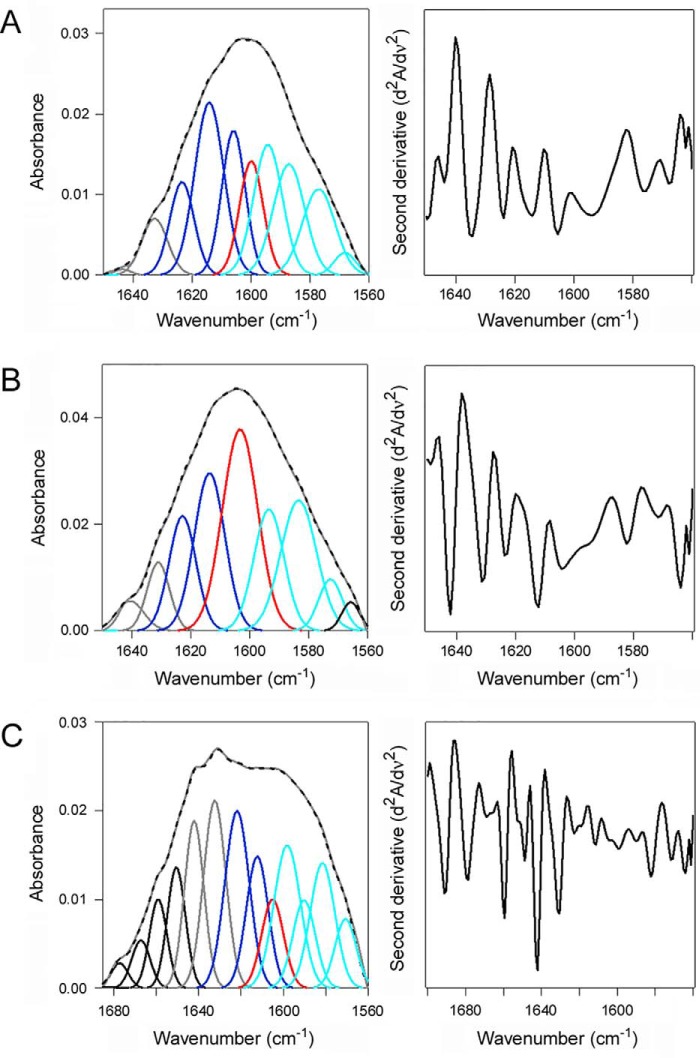
Figure 7.
HSC70 induces a gain-of-structure in disordered CTA1. The FTIR spectrum of uniformly 13C-labeled CTA1 was recorded in the absence or presence of HSC70. In the curve fitting panels of the left column, the dashed line represents the sum of all deconvoluted components from the measured spectrum (overlapping gray line). Deconvoluted components are presented in dark blue (α-helix), light blue (β-sheet), red (irregular), gray (other/turns), and black (side chains and, in C, the unlabeled protein). The right column presents the respective second derivatives. A, 13C-labeled CTA1 structure at 10 °C. B, 13C-labeled CTA1 structure after 30 min at 37 °C. C, 13C-labeled CTA1 structure in the presence of unlabeled HSC70 at 37 °C. CTA1 was heated to 37 °C for 30 min before the addition of HSC70.

