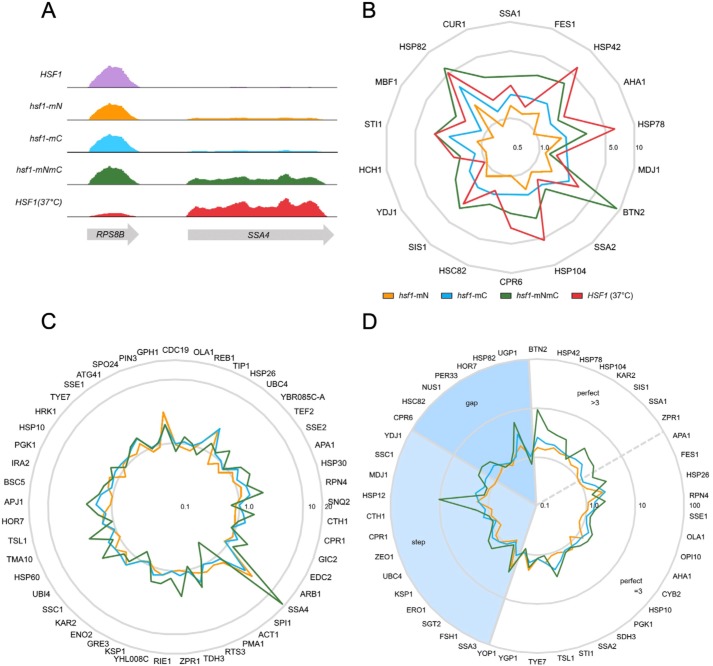
Figure 5.
Global dysregulation of the Hsf1 transcriptional program in the absence of regulation by Ssa1. A, mapped reads of RNA abundance from the indicated strains and for WT cells (HSF1) heat-shocked at 37 °C for 15 min for the neighboring genes RPS8B and SSA4 displayed using IGV version 2.4.15. Vertical scale is 0–25,000 for all tracks. B, radar plot of the -fold change in FPKM for the set of target genes that require Hsf1 for basal and induced gene expression, normalized to WT at 30 °C and plotted with a logarithmic radial scale. C, radar plot of the -fold change in FPKM values for the set of target genes that require Hsf1 only for heat shock induction, normalized to WT at 30 °C and plotted with a logarithmic radial scale. D, radar plot of the -fold change in FPKM values for genes with defined HSE architecture. Step, gap, and perfect HSE arrangements are as described under “Introduction.” Genes with perfect HSE architecture were further divided into those with three inverted HSE repeats or with greater than three inverted repeats.

