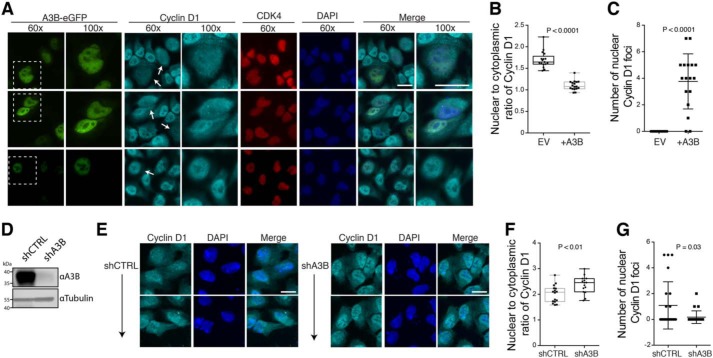
Figure 6.
A3B disrupts CDK4-dependent nuclear import of Cyclin D1. A, three sets of representative immunofluorescence microscopy images of HeLa cells transfected with A3B–eGFP and stained for endogenous Cyclin D1, endogenous CDK4, and DAPI (×60 magnification image scale bar, 20 μm). A ×100 magnification of the boxed regions is also provided for Cyclin D1-stained, A3B–eGFP expressing cells for better visualization of Cyclin D1 redistribution and foci (white arrows). B and C, whiskered dot plots for quantification of nuclear to cytoplasmic ratio of Cyclin D1 as well as number of Cyclin D1 foci, respectively (n = 20 cells; p values calculated using an unpaired Student's t test). D, immunoblots showing A3B levels in U2OS cells stably expressing an A3B-specific short hairpin RNA construct (shA3B) or a nonspecific shRNA construct as a control (shCTRL). E, two sets of representative immunofluorescence microscopy images of U2OS cells stably expressing shCTRL or shA3B constructs and stained for endogenous Cyclin D1 and 4′,6-diamidino-2-phenylindole (DAPI) (scale bar, 10 μm). F and G, whiskered dot plots for quantification of nuclear to cytoplasmic ratio of Cyclin D1 as well as number of Cyclin D1 foci, respectively (n = 20 cells; p values calculated using an unpaired Student's t test).

