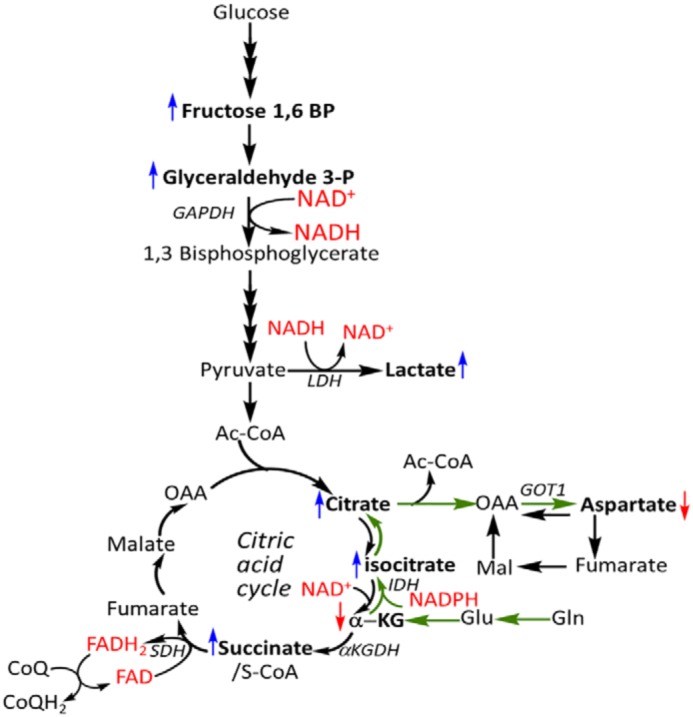
Figure 8.

Several H2S-sensitive metabolite changes map to redox active nodes in central carbon metabolism. Shown is a schematic of central carbon metabolism, including the glutamine-dependent reductive carboxylation pathway (green arrows) that is stimulated by H2S. Changes in metabolites are denoted by the same color scheme used in Fig. 7 (i.e. blue and red arrows represent increases and decreases, respectively).
