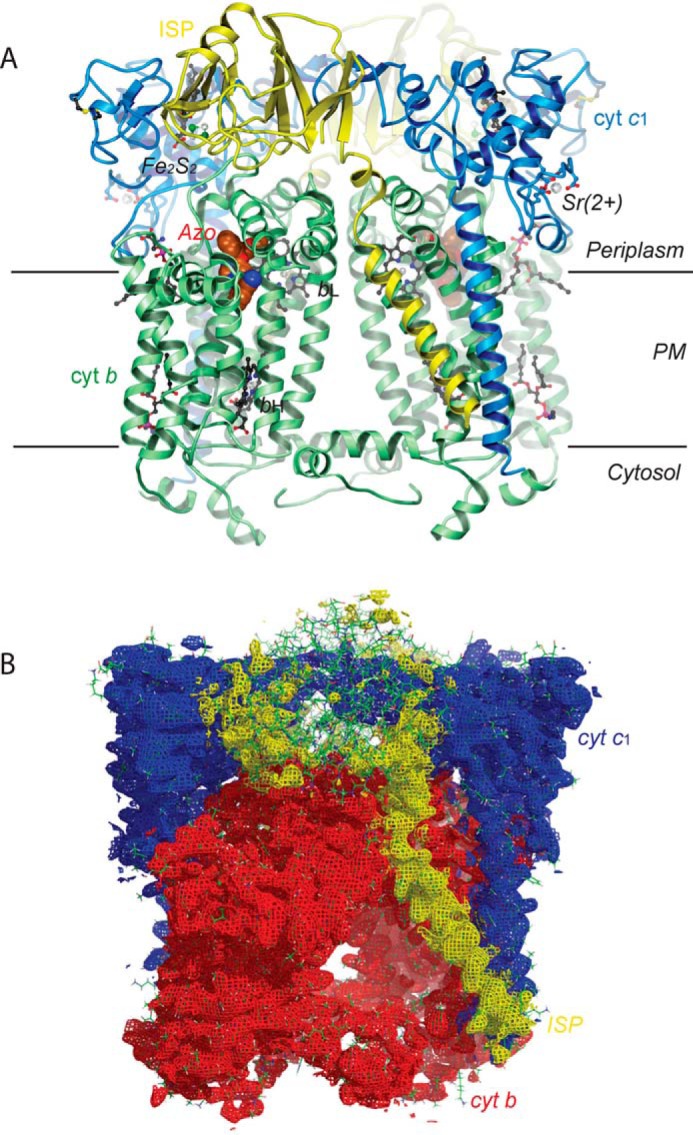
Figure 3.

Structure of Rsbc1/azo with ISP–ED disordered. A, two cyt b subunits are shown as green ribbons containing the bH and bL heme groups. Azoxystrobin is shown as a CPK model and lipid molecules as ball-and-stick models. The two cyt c1 subunits with covalently linked c-type hemes are shown in blue. The bound Sr2+ ions (silver spheres) stem from a crystallization additive. Both yellow ribbon models of the iron–sulfur protein are highly disordered and are shown in a position that places their Fe2S2 clusters in or near a position with detectable anomalous signal from their iron atoms. The parallel horizontal lines delineate the boundary of the membrane bilayer. B, electron density for the Rsbc1/azo dimer with cyt b in red, cyt c1 in blue, and ISP in yellow. Although the N-terminal helix of ISP has a good electron density, the head domain is largely disordered.
