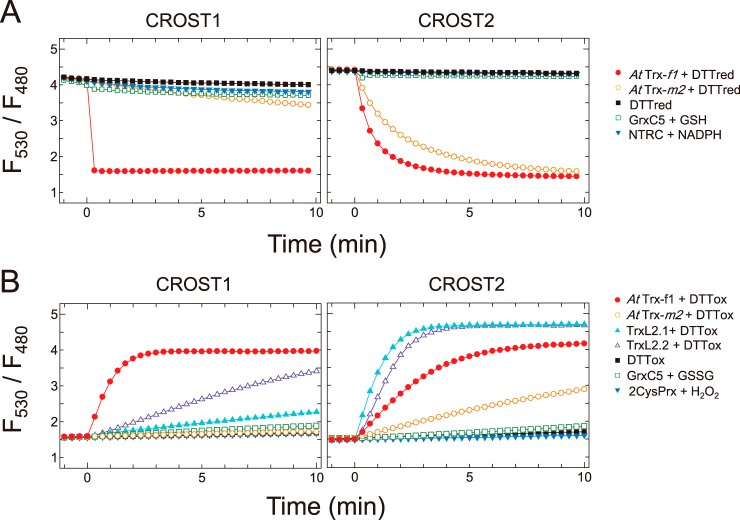
Figure 2.
Reduction and oxidation of CROST proteins. A, reduction of CROST1 (left) and CROST2 (right) by reductants. Fluorescence intensity ratios (530/480 nm) of 0.1 μm oxidized CROST proteins at 25 °C in 50 mm Tris-HCl (pH 7.5), 50 mm NaCl, and 1 mm EDTA were plotted before and after addition of reductants at time 0 as follows: closed circles, 0.2 μm AtTrx-f1 + 100 μm DTTred; open circles, 0.2 μm AtTrx-m2 + 100 μm DTTred; closed squares, 100 μm DTTred; open squares, 0.2 μm AtGrxC5 + 2 mm GSH; closed inverted triangles, 0.2 μm AtNTRC + 100 μm NADPH. B, oxidation of CROST1 (left) and CROST2 (right) by oxidants. Fluorescence intensity ratios of 0.1 μm reduced CROST proteins were plotted before and after addition of reductants at time 0 as follows: closed circles, 0.2 μm AtTrx-f1 + 50 mm DTTox; open circles, 0.2 μm AtTrx-m2 + 50 mm DTTox; closed triangles, 1 μm AtTrxL2.1 + 50 mm DTTox; open triangles, 1 μm AtTrxL2.2 + 50 mm DTTox; closed squares, 50 mm DTTox; open squares, 0.2 μm AtGrxC5 + 1 mm GSSG; closed inverted triangles, 0.2 μm At2CysPrx + 0.1 mm H2O2. In the presence of 0.2 μm AtTrx-f1 and 0.5 mm DTTred, 10 μm CROST sensors were reduced for 30 min at 25 °C before measurements and diluted to a useful concentration.

