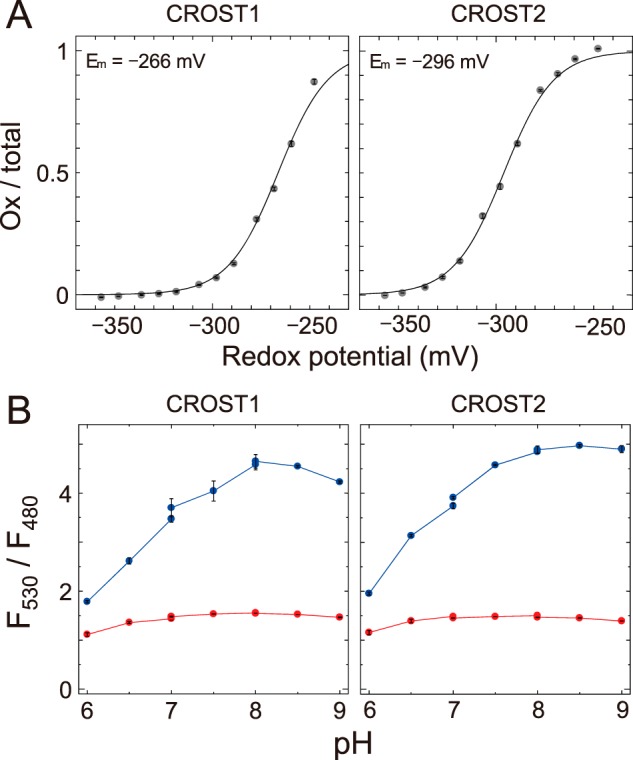
Figure 5.

Redox potential and pH dependence of CROST sensors. A, the oxidation levels of CROST1 (left) and CROST2 (right) were quantified as the ratios of the oxidized forms to the total and plotted against the redox potential of DTT buffer (pH 7.5). Data were fitted to the Nernst equation for two electrons exchanged (y = 1/(1 + exp(0.078 (x − Em)))). The midpoint redox potential value shown in the figure is the mean ± S.D. (four independent experiments using two different protein preparations). B, fluorescence ratios (F530/F480) of recombinant CROST1 (left) and CROST2 (right) under different pH levels were measured for their oxidized (blue lines) and reduced (red lines) forms. The buffers MES (for pH 6–7), PIPES (for pH 7–8), and HEPES (for pH 8–9) were used.
