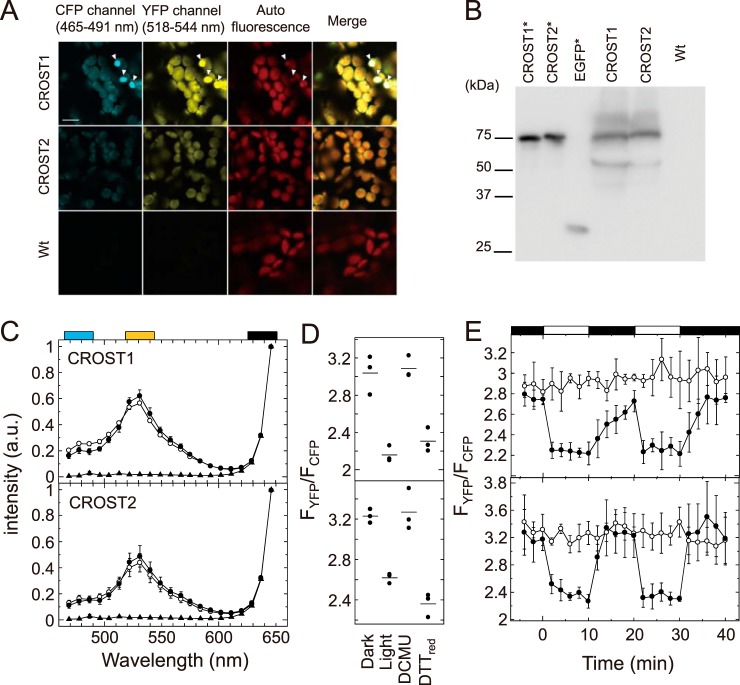
Figure 6.
Visualization of intracellular Trx activities. A, fluorescence images of transgenic plant leaves expressing CROST1 and CROST2 and of WT leaves were obtained using an Ar 458-nm laser for excitation. Images from 465 to 491 nm for CFP and from 518 to 544 nm for YFP were taken. Chlorophyll autofluorescence from 624 to 651 nm was also assessed, and merged images were created (scale bar = 10 μm). B, immunoblot analysis of the expression of CROST1 and CROST2 in leaves using an antibody against GFP. Recombinant CROST1, CROST2, and EGFP were used as controls (asterisks). C, emission spectra of CROST1 (top) and CROST2 (bottom) expressed in chloroplasts were measured using a confocal microscopy under dark (closed circles) and light (50 μmol photons m−2 s−1, open circles) conditions. Emission spectra of WT A. thaliana cells were measured as a control (closed triangles). The obtained spectra were standardized at the chlorophyll autofluorescence region (black box) using the least square method. Cyan and yellow boxes show the region used for observation of CFP and YFP, respectively. a.u., arbitrary unit. D, fluorescence intensity ratios of CROST1 (top) and CROST2 (bottom) in the dark and under light (50 μmol photons m−2 s−1) conditions were calculated and plotted. Fluorescence intensity ratios in the presence of 20 mm DTTred and 20 μm DCMU were determined as well. The results of three independent experiments are shown. Bars show the average. E, fluorescence intensity ratio changes of CROST1 (top) and CROST2 (bottom) under mutual light (50 μmol photons m−2 s−1)/dark conditions in the absence (closed circles) and presence (open circles) of 20 μm DCMU were calculated at every 2 min and plotted. The light period is indicated by white rectangles above the graph. Results obtained from three independent experiments are shown with error bars.

