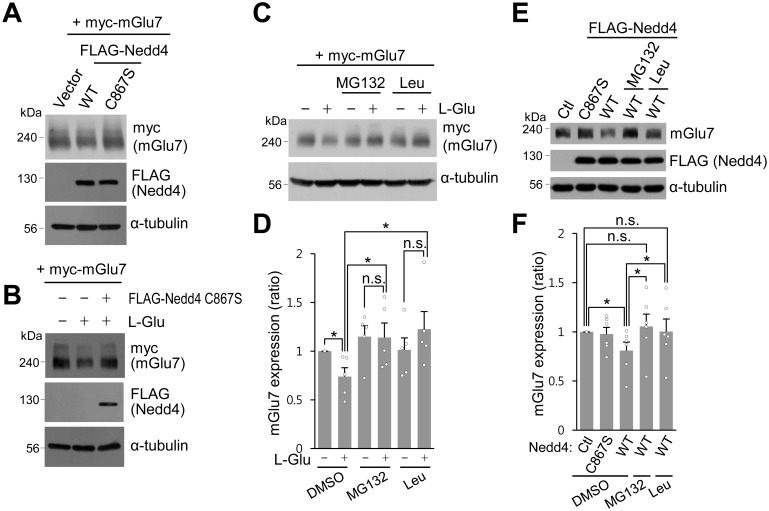
Figure 7. Nedd4-mediated or agonist-stimulated mGlu7 degradation occurs via both the proteasomal and lysosomal degradation pathways.
(A) myc-mGlu7 and FLAG-Nedd4 WT or C867S were co-transfected in HEK 293 T cells. Thirty-six hours after transfection, cell lysates were analyzed by western blotting using the indicated antibodies. (B) Following transfection, cells were starved overnight in serum-free DMEM culture medium and then treated with 1 mM L-Glu for 1 hr. Cell lysates were analyzed by western blotting using the indicated antibodies. (C) HEK 293 T cells transiently expressing myc-tagged mGlu7 was incubated with 100 μM MG132 or 52.5 μM leupeptin (Leu) for 2 hr and then L-Glu was added for 1 hr. Cell lysates were analyzed by SDS-PAGE and western blotting using the indicated antibodies. (D) Summary histograms quantifying mGlu7 expression in panel C. Bar graph represents mean ± SEM of band intensities normalized to control lane (DMSO + L-Glu, 0.74 ± 0.09; MG132, 1.15 ± 0.11; MG132 + L-Glu, 1.14 ± 0.15; Leu, 1.01 ± 0.12; Leu + L-Glu, 1.23 ± 0.18; n = 5, *p<0.05, n.s. indicates p>0.05, Student’s t-test). (E) FLAG-tagged Nedd4 WT or Nedd4 C867S was expressed on cultured cortical neurons via lentiviruses. After treatment with 0.5 μg/ml cycloheximide for 21 hr, the neurons were incubated with 100 μM MG132 or 52.5 μM Leu for 4 hr and then 400 μM L-AP4 was added for 1 hr. Cell lysates were analyzed by western blotting using the indicated antibodies. (F) Summary histograms quantifying mGlu7 expression in panel E. Bar graph represents mean ± SEM of band intensities normalized to control lane (Nedd4 C867S, 0.98 ± 0.07; Nedd4 WT, 0.81 ± 0.09; Nedd4 WT + MG132, 1.06 ± 0.13; Nedd4 WT + Leu, 1.00 ± 0.13; n = 5, *p<0.05, n.s. indicates p>0.05, Student’s t-test).

