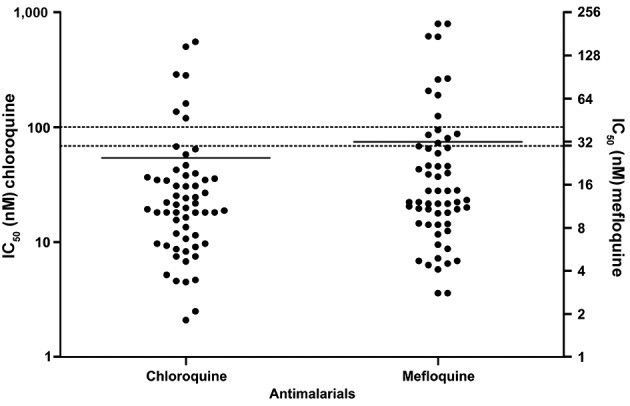
Fig. 4: distribution of 50% inhibitory concentration (IC50) values in Plasmodium vivax isolates for chloroquine and mefloquine using Deli-test. The values correspond to individual IC50 values. Lines represent geometric mean. The dotted line represents the resistance threshold for chloroquine (100 nM) and for mefloquine (30 nM).

