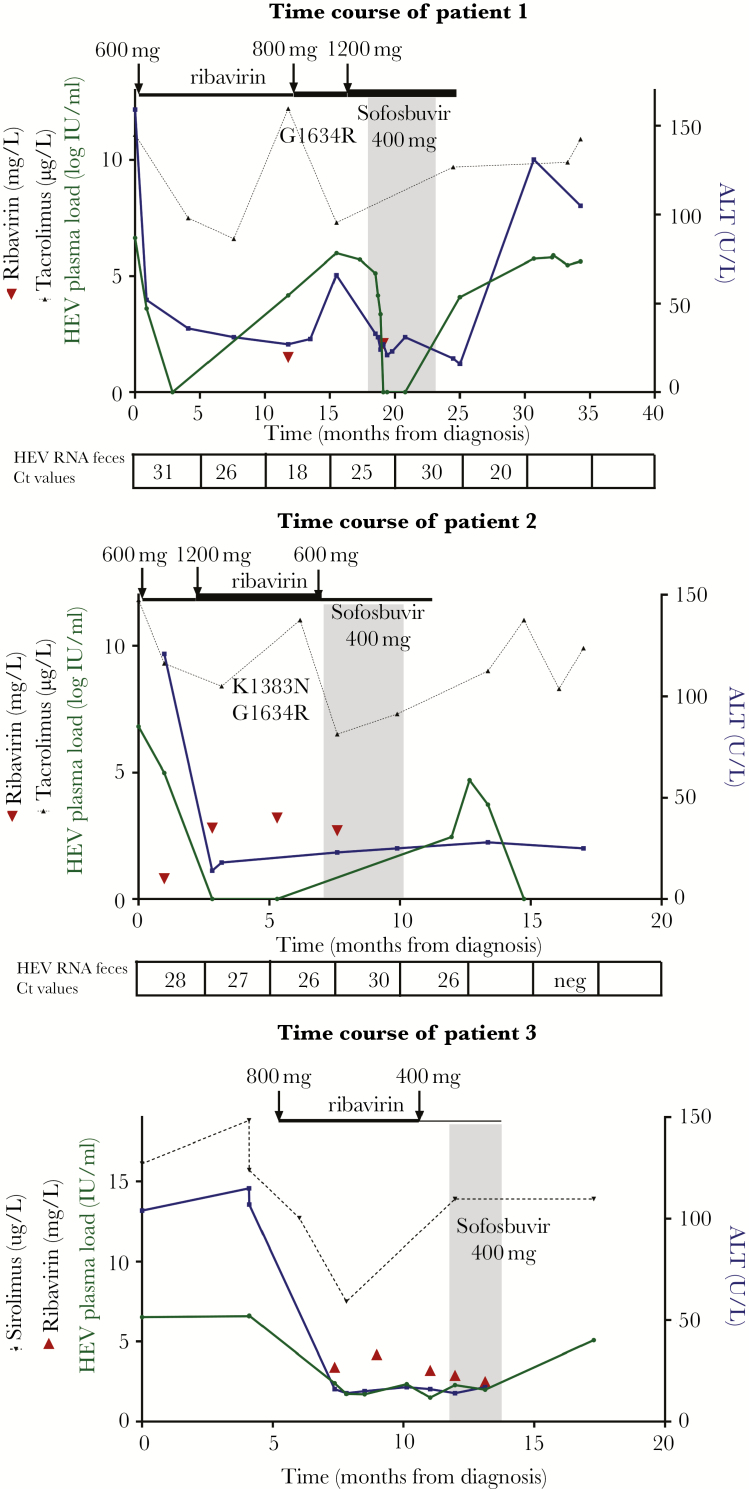
Figure 1.
Graphs indicate the following: therapeutic interventions, hepatitis E virus (HEV) plasma and fecal load, alanine aminotransferase (ALT) levels, ribavirin levels, sirolimus/tacrolimus levels, and presence of mutations. (x-axis) Time from diagnosis of HEV infection. (y-axis, left) Hepatitis E virus plasma load (green), ribavirin levels (red), and sirolimus/tacrolimus levels (black). (y-axis, right) Alanine aminotransferase level (blue). Sofosbuvir treatment is indicated by the gray box. Ribavirin dosing changes are shown by the black arrows and the thickness of the line. In the boxes below the graphs, the presence of HEV RNA in feces is depicted, expressed in cycle threshold (Ct) values. The x-axis of the graph indicates the time point. For patient 3, HEV loads in feces were not measured.

