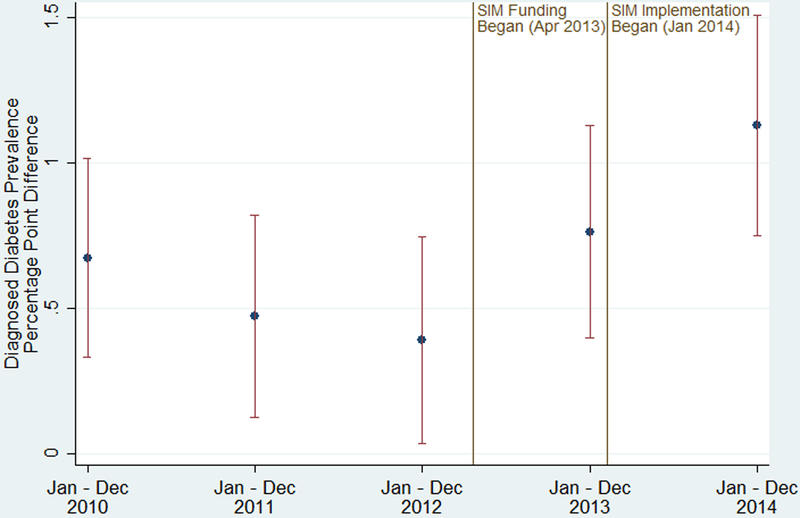
Figure 1: Unadjusted, Mean Differences in Diagnosed Diabetes Prevalence Among Adults for SIM versus Comparison Counties, 2010–2014.
Notes: SIM funding began on Apr 1, 2013, which included an initial 6-month test period, resulting in the test implementation phase beginning Oct 1, 2013. Because the diagnosed diabetes prevalence data is annual, we modeled the implementation period as beginning Jan 1, 2014. Prevalence differences were calculated each year by subtracting the mean of the county-level prevalence in the 240 SIM counties from the mean of the county-level prevalence in the 343 comparison counties. The error bars are 95% confidence intervals of the difference in the mean prevalence by year. Apr indicates April; Dec, December; Jan, January; Oct, October; SIM, State Innovation Model
Source: Authors’ analysis of Centers for Disease Control and Prevention’s county-level estimates

