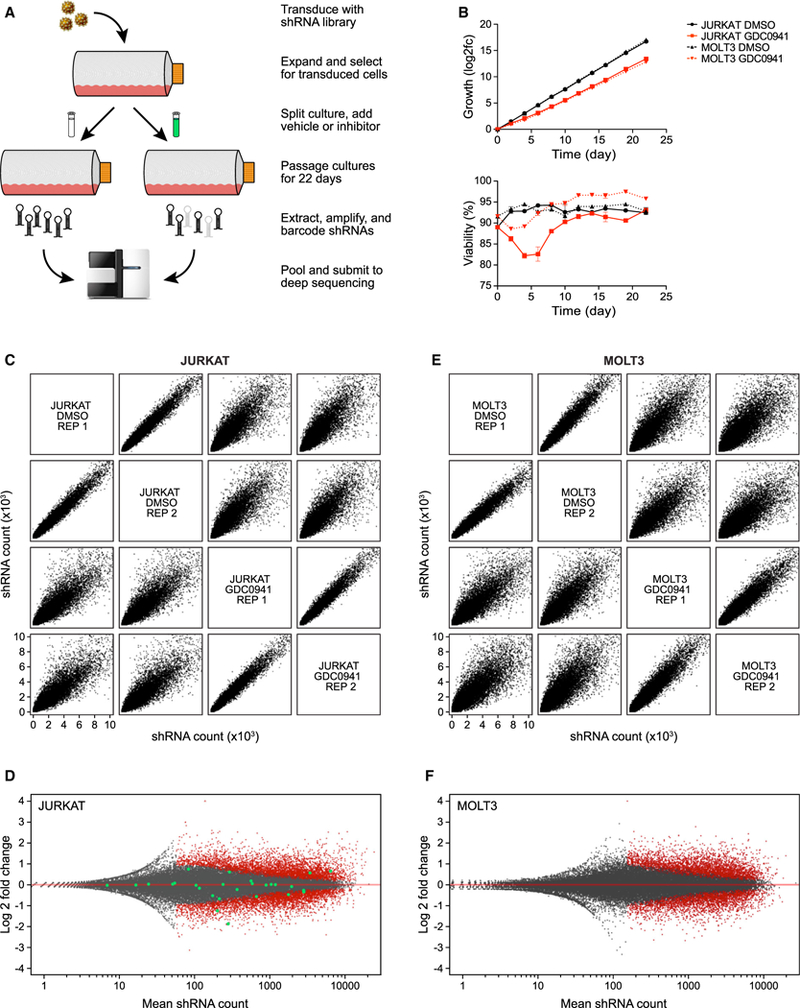
Figure 2. Synthetic Lethal shRNA Screens with a Leukemia Platform.

(A) Schematic representation of shRNA synthetic lethal screen screening procedure.
(B) Growth (top) and viability (bottom) of JURKAT and MOLT3 cells during screen.
(C) Comparisons of deep sequencing results from JURKAT screen, plotting all shRNA read counts of replicates from control and GDC0941-treated samples against one another.
(D) Distribution of individual shRNAs from JURKAT screen, with significant shRNAs labeled in red; shRNAs targeting MAPK9 as an example are highlighted in green.
(E) Same as (C), but for MOLT3 screen.
(F) Same as (D), but for MOLT3 screen.
