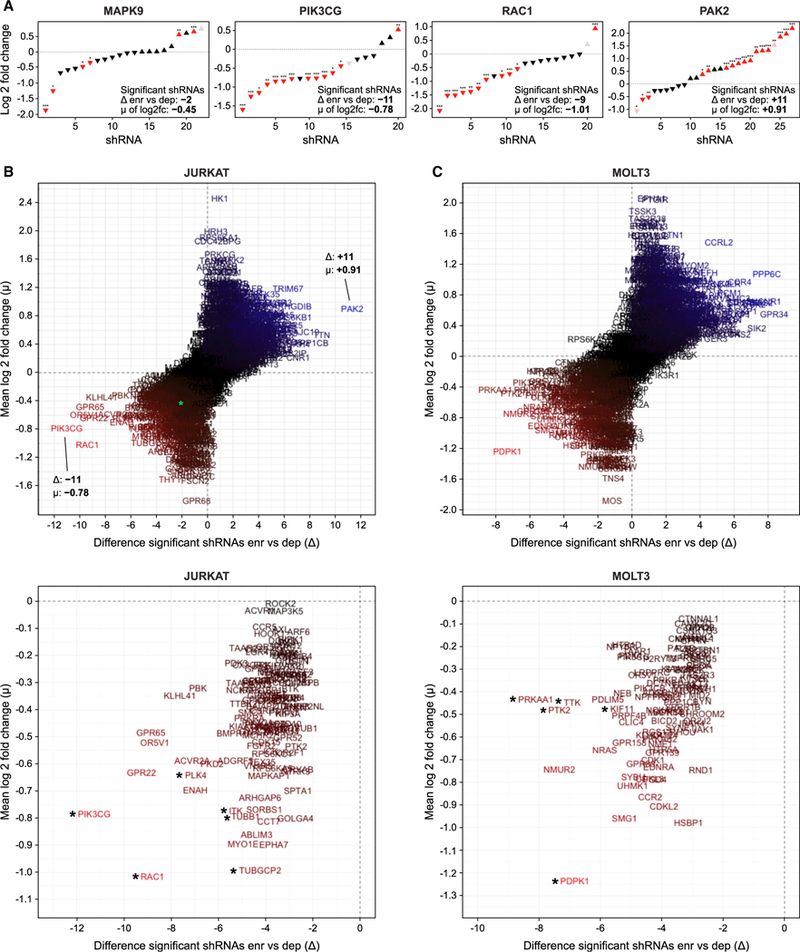
Figure 3. A Searchable Resource of Highly Saturated Synthetic Lethal Screen shRNA Screens.

(A) Distribution of all shRNAs targeting selected genes from the JURKAT synthetic lethal screen, with difference △ of significantly depleted versus enriched shRNAs, and mean m of the significance of all of the shRNAs per single target.
(B) Dispersion of all of the genes represented in the JURKAT screen, with MAPK9 as an example highlighted in green (top), and magnified illustration of the depleted genes (bottom), with asterisks indicating targets selected for further verification with inhibitors.
(C) Same as (B), but for MOLT3 screen. All individual targets can be explored in our searchable database of our synthetic lethal screen with GDC0941 (https://mmues.shinyapps.io/K7screen/).
