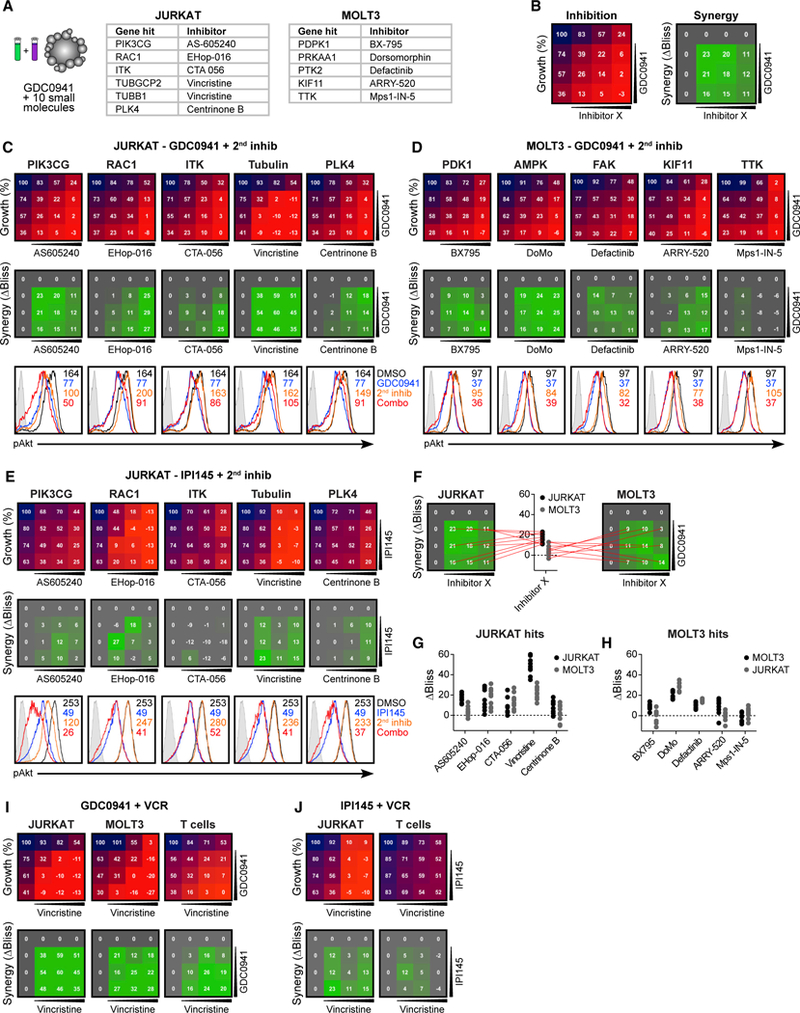
Figure 4. Pharmacological Inhibition in Combination with GDC0941 Validates Synthetic Lethal Screen Hits.

(A) Candidate genes selected from synthetic lethal screen for verification by Inhibitor combinations.
(B) Schematic representation of testing for inhibitor combinations, depicting cellular growth inhibition by inhibitors alone or combined (left), and resulting ΔBliss values indicating synergistic efficacy as calculated from expected and observed growth inhibition (right).
(C) 4 × 4 grids with combinatorial inhibitor titrations to test for the synthetic lethality of candidates from JURKAT screen on JURKAT cells, depicting growth (top) and inhibitor synergy (center). Phospho-flow analysis of baseline (black) phospho-Akt levels and treatment with GDC0941 (blue), second inhibitor alone (orange), or a combination of both (red) (bottom).
(D) Same as (C), but for the candidates from the MOLT3 screen tested on MOLT3 cells. For reciprocal tests, see Figure S5.
(E) Same as (C), but using IPI145 to test candidates from the JURKAT screen on JURKAT cells (n = 2).
(F) Example plots depicting the selection of ΔBliss values for each inhibitor tested.
(G and H) Summary of all 9 ΔBliss values from inhibitor combinations for candidates from the JURKAT screen (G) and from the MOLT3 screen (H).
(I) 4 × 4 grids with combinatorial GDC0941 and vincristine titrations, depicting growth (top) and inhibitor synergy (bottom) in JURKAT, MOLT3, and normal primary T cells (n = 4).
(J) Same as (I), but using IPI145 and vincristine.
(C)–(E), (I), and (J) are representative examples of ≥3 independent experiments (n = 4).
