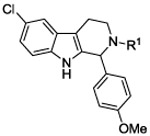
TABLE 3.
 | ||
|---|---|---|
| ID | R1 | EC50 (nM)a |
| C60 |  |
157 |
| 3 | −H | 215 |
| 9 |  |
228 |
| 10 |  |
2432 |
| 11 |  |
154 |
| 12 |  |
168 |
| 13 |  |
4267 |
| 14 |  |
434 |
| 15 |  |
1576 |
| 16 |  |
8030 |
| 17 |  |
4008 |
EC50 values represent the average of at least 3 separate experiments.
 | ||
|---|---|---|
| ID | R1 | EC50 (nM)a |
| C60 |  |
157 |
| 3 | −H | 215 |
| 9 |  |
228 |
| 10 |  |
2432 |
| 11 |  |
154 |
| 12 |  |
168 |
| 13 |  |
4267 |
| 14 |  |
434 |
| 15 |  |
1576 |
| 16 |  |
8030 |
| 17 |  |
4008 |
EC50 values represent the average of at least 3 separate experiments.