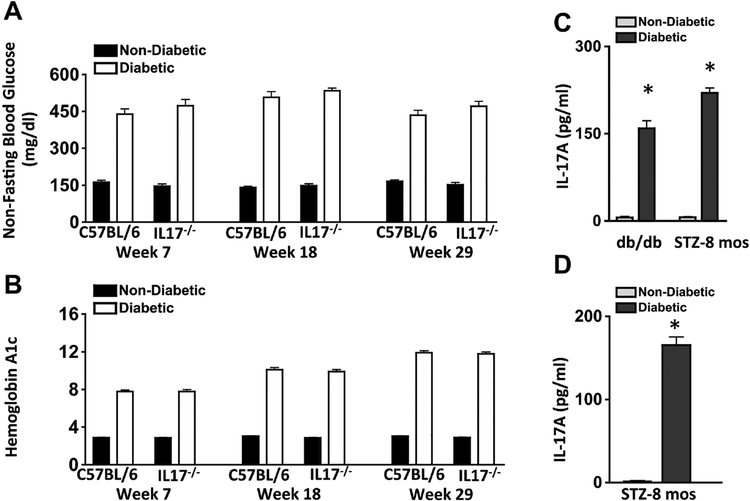
Figure 1. Analysis of diabetes and IL-17A production in mice.
Assessment of Non-Fasting Blood Glucose (A) and Glycated Hemoglobin A (B) in non-diabetic (black) and STZ-injected diabetic (white) mice throughout the 8-month duration to confirm diabetes in C57BL/6 and IL-17−/− mice (n=10 mice/group). C) Protein levels of IL-17A in serum of non-diabetic (grey) and spontaneous diabetic (black) db/db mice, and non-diabetic (grey) and STZ-induced diabetic (black) mice. Sera samples (n=5/group) were collected 2-months or 8-months after diabetic conditions were confirmed in db/db and STZ-diabetic mice respectively. D) Quantification of IL-17A in retinas (n=6) of non-diabetic (grey) and diabetic (black) mice, 8-months after diabetic conditions was confirmed. * = p<0.01 per unpaired student’s t-test. Data are representative of three separate experiments.

