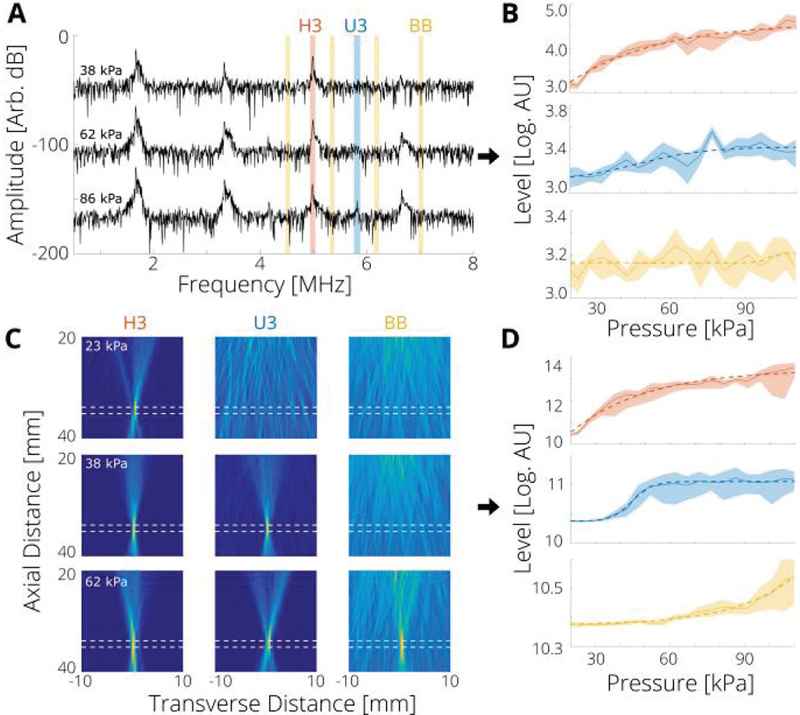
Fig. 2.
Cavitation thresholds measured by PAM have smaller uncertainty compared with single element passive cavitation detection. (A) Representative measured single channel (center channel of imaging array) spectra for the indicated applied pressure. The range from which the acoustic emission level of each component—third harmonic (H3), third ultra-harmonic (U3), and broadband (BB)—was taken is shaded as red, blue and yellow respectively. (B) Measured single channel levels as a function of applied pressure for each frequency: 3f0 (4.986 ± 0.019 MHz) for the harmonic (H3), 3.5f0 (5.817 ± 0.019 MHz) for ultra-harmonic (U3), and 2.72f0, 3.22f0, 3.72f0, and 4.22f0 (4.52, 5.35, 6.18, 7.01 ± 0.019 MHz), for the broadband. (C) Representative PAMs at the indicated applied pressure for each frequency range; dashed white lines represent the approximate position of the tube. (D) Measured PAM levels as a function of applied pressure. In the current set up, localization was accurate to within 1 mm. In (B) and (D), shaded range is standard deviation across 6 measurements, and dashed lines are models computed from Eq. (5).

