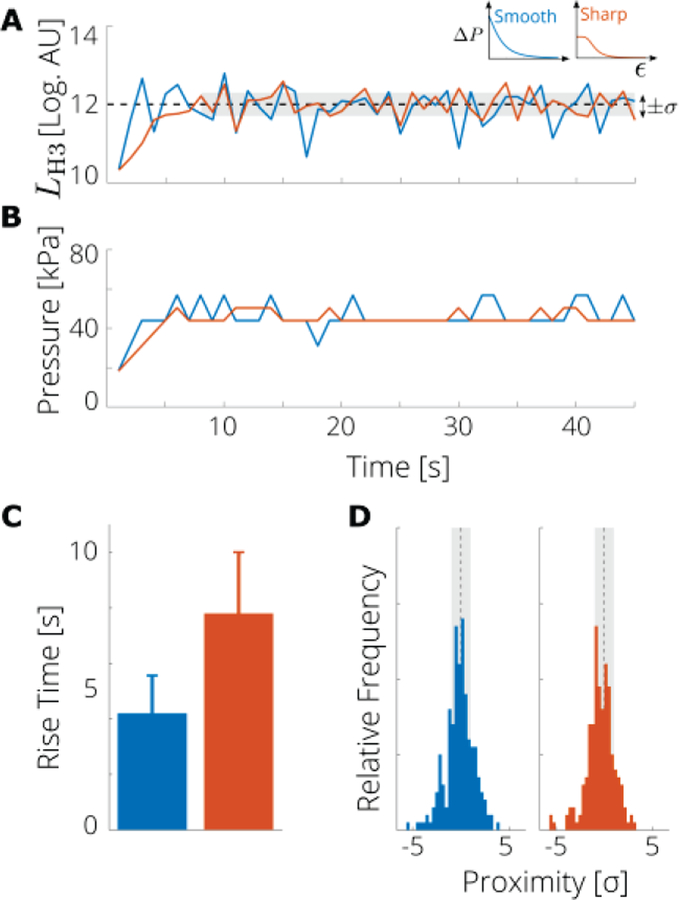
Fig. 3.
A nonlinear state controller based on PAM with the step size determined by the emission level of the third harmonic (H3) can attain and sustain a desired level of cavitation activity. (A) Measured acoustic emission level of the H3 compared with target value (dashed black line) and tolerance (gray region) a representative run of each controller. (B) Applied pressure at each step for a representative run with the smooth (blue) and sharp (orange) control laws. (C) Rise times; error bar represents the standard error (5 runs). (D) Histogram of proximity of H3 level to target value, i.e., the difference between all measured levels (after the target level was first reached) and the target value (dashed black line) in terms of the tolerance σ.Vertical scale is 40 counts.

