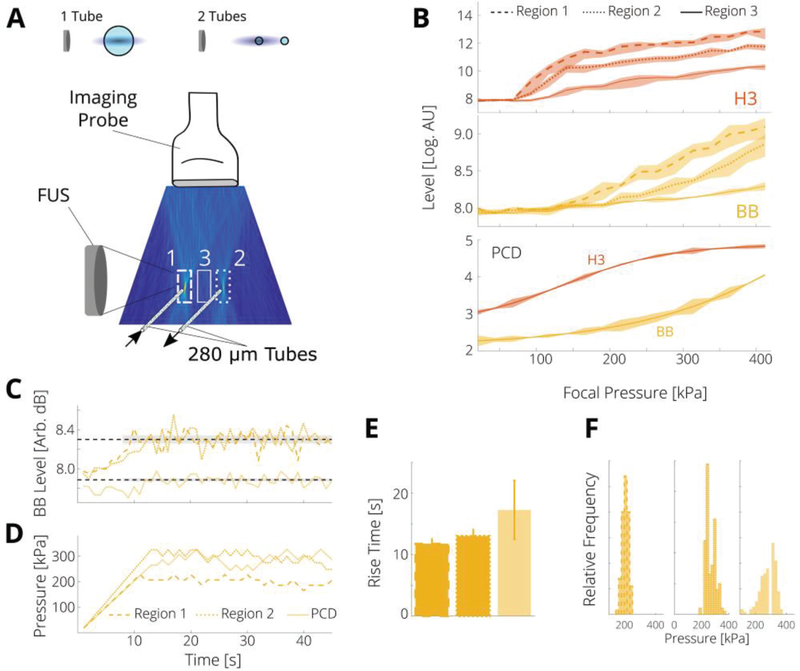
Fig. 7.
PAM controller enables spatial selectivity. (A) Bubbles were flowed through 2 parallel tubes, one was placed in the focal region of the FUS and the other at the edge. Relative sizes of tubes are shown at top (FUS not to scale). (B) The level in Region 1 (dashed lines) was generally higher than Region 2 (dotted lines) as Region 1 is in the focus, and Region 3 (solid lines), which contained no cavitation activity. PCD levels from a single channel are shown for comparison. These data have no regional selectivity. (C) Control of the level of BB emissions was achieved in Regions 1 and 2, and with single channel PCD (level shifted upward for ease of comparison). (D) Control required lower applied pressures for Region 1, as this includes the focal region. (E) Rise times were longer for this case. (F) The applied pressures were generally lower for Region 1 than for Region 2, though both regions had lower variance in pressure than the PCD controller; vertical scale is 40 counts.

