Figure 5.
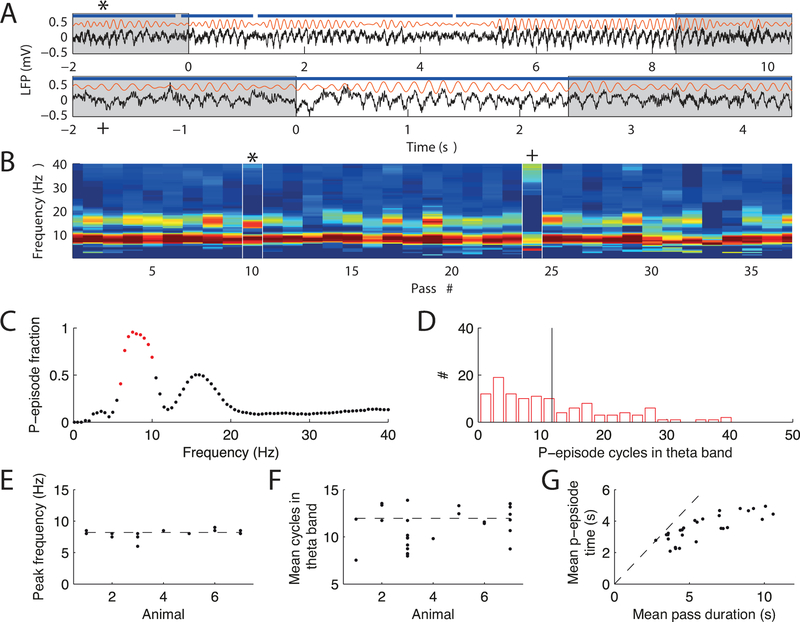
Episodes of locomotion-dependent theta. (A) Two examples of raw LFP (black) and theta band filtered LFP (orange). The white background indicates one pass (starting at t = 0) from reward location to reward location. Blue line indicates significant episodes (p-episodes) of sustained theta. (B) Fraction of time spent in significant p-episodes (color code is from 0 % in blue to 100 % in red) for each frequency band. An example recording session with 37 passes is shown, and the white marks indicate the passes shown in A. (C) Fraction of p-episodes averaged over all passes in B. Red dots indicate the theta band. The second peak corresponds to the theta harmonic at 16 Hz. (D) Histogram of p-episode lengths from the theta band in B. Black line indicates the mean. (E) Frequency at highest p-episode fraction (determined from analysis shown in C) for all sessions and animals (each dot is a recording session). Dashed line indicates the mean. (F) Mean p-episode length for each session and animal. Dashed line indicates the mean. (G) Mean time within a p-episode vs. mean duration of a pass. Each dot marks a recording session on the linear track. The bisecting line (dashed) is shown for comparison. For short passes with continuous running, the p-episode lengths are comparable to the run time. There is a decrease in p-episode length for longer passes because theta periods become interrupted at slow movement speeds that typically involve pauses.

