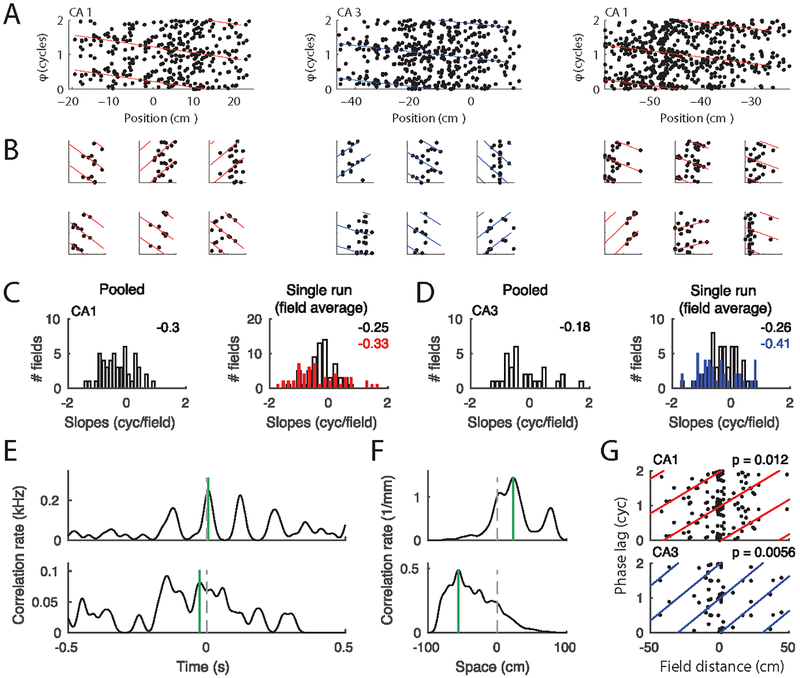
Figure 6.
Phase precession and theta compression. (A) Phase precession in three example place fields (from three animals) pooled over all runs in a session. Position is normalized to place field width. Colored lines indicate the best circular-linear fit to the data. The phase axes show two cycles, and every spike as well as the fitted lines are thus plotted twice. (B) Spike phases from six single paths per field from the three fields in A. The four left-most single trials showed significant phase precession (p < 0.05). The two right most examples show trials with non-significant precession (p>0.05). P values were obtain using circular-linear regression (Kempter et al., 2012).(C) Left: Histogram of slopes of circular-linear fits to pooled data (as in A) for the whole population of CA1 place fields. Right: Slopes of fits to single passes. Open bars include the average of all slopes per field and red bars include the average of the significant single trial slopes through each field. The numbers on the right upper corners indicate the means of the distributions. (D) as C, but for CA3 data (blue). (E) Spike cross-correlation functions provide an estimate of temporal separation within a theta cycle. Two example place cell pairs are shown. Stippled vertical lines depict zero and green vertical lines depict the peak closest to zero. (F) Cross-correlations (in units of spike pairs per spatial bin) between firing rates along the track provide an estimate of place field distance (Colors as in E). (G) Theta phase lag (time lag as shown in E translated to the Hilbert phase of the theta band LFP) as a function of place field distance for CA1 (top) and CA3 (bottom) fields. Colored lines indicate circular linear fits, and P-values indicate significance of circular linear correlation. The circular linear correlations (Kempter et al., 2012) are R = 0.37 for CA1 (n = 81) and R = 0.58 for CA3 (n = 42).

