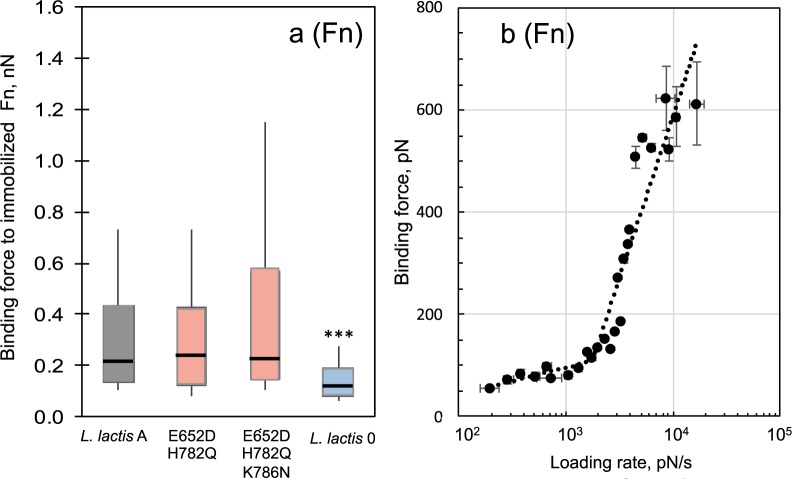
Figure 5.
(a) Box and whisker plots of L. lactis strains binding to Fn as determined by AFM. Whisker ends 9th and 91st percentiles. Box ends 25th and 75th percentiles. Median is marked with horizontal line. Blue- or red-colored boxes represent median force values that are, respectively, less than or greater than the wild type strain (L. lactis A). P-values calculated using Mann-Whitney, where p < 0.001 is indicated by ***. (b) Dependence of binding or dissociation force (f; pN) on the logarithm of the loading rate, (r; pN s−1) between FnBPA expressed on the surface of the L. lactis E652D/H782Q and Fn. This dependence is described by the Bell model f = (kBT/xβ) × (In (r xβ/koff kB T)), where r(pNs−1) is the product of the retraction velocity (nm s−1) and the slope of the force-distance curve at binding (pN nm−1), koff is the dissociation rate constant in the absence of the applied force, xβ is the position of the activation barrier, and kBT is the thermal energy where kB is Boltzmann constant and T is temperature (4.1 pN nm at room temperature). AFM measurements were conducted in PBS at retraction velocities between 0.05 and 18.8 µm/s. AFM tips were coated with protein by incubating tips in 100 µg/mL of Fn or Fg prior to force measurements.

